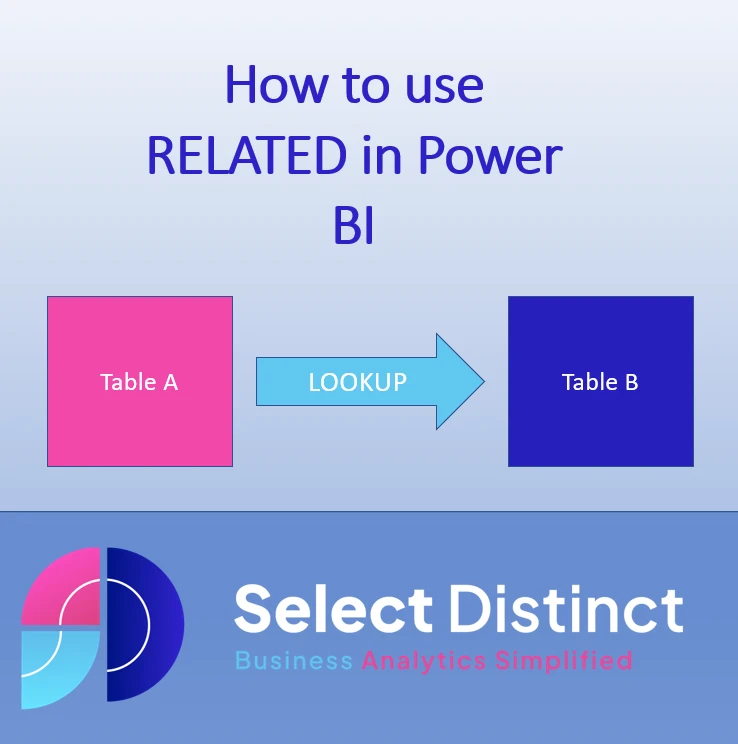
What is the Power BI RELATED function
The Power BI RELATED function is a powerful tool that allows users to quickly and easily access related data from a related table
It is similar in many ways to using lookups in Excel (VLOOKUP), Excel users wanting to learn this function will find the syntax fairly intuitive to follow. In this example we will use the Related function to return a standard cost per mile using a type of vehicle as a lookup reference, to then calculate the costs depending on the mileage covered in each vehicle.
We also discuss the Power BI LOOKUPVALUE value function.
When to use the Related Function in Power BI
If you need to refer to a value in a related table and use that in a calculated column or a measure in another table, in our example we will show it used in a calculated column
The RELATED function can be used when there is a clear relationship between tables that can return a single row, if a relationship does not exist one must be created
It will not work if the look up would return more than one record, in our example using vehicles types later on in this post, if there was more than one record in the costs a a vehicle type then it would not work
If you have a use case which needs to find a parent category for a specific item it would work, e.g. If I have a product code relating to a pack of socks I can use that code to find a category name for socks as there is likely to be only one record. But if I try to the reverse, return a product code for the socks category, it would be likely that many product codes could be found so it would not work
How to use the Related Function in Power BI
You can follow the steps in this guide by downloading this data in Excel
Power BI RELATED Function
In the data file we have three data sets
Vehicles – a list of unique vehicles, and their types
Vehicle Types – a list of unique types of vehicle
Miles – a daily list of mileage travelled in each vehicle
Costs – a standard cost per mile for each vehicle
This data set is simplified to help with clarity
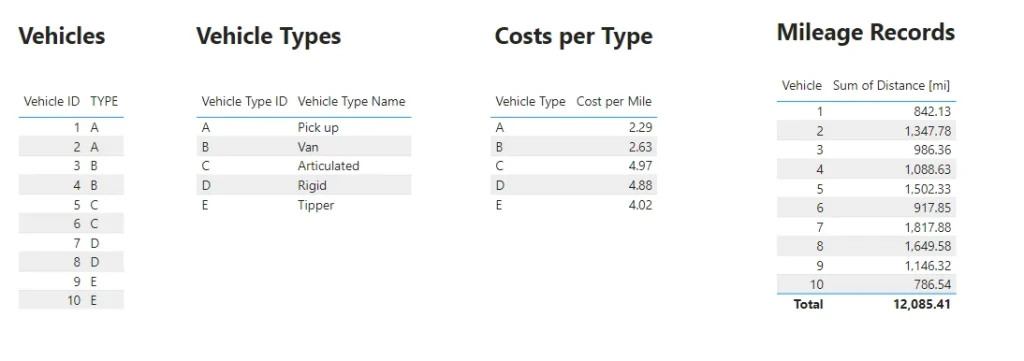
We want to be able to report the costs for each vehicle based on the mileage records, using a lookup for the standard cost per mile for each type of vehicle
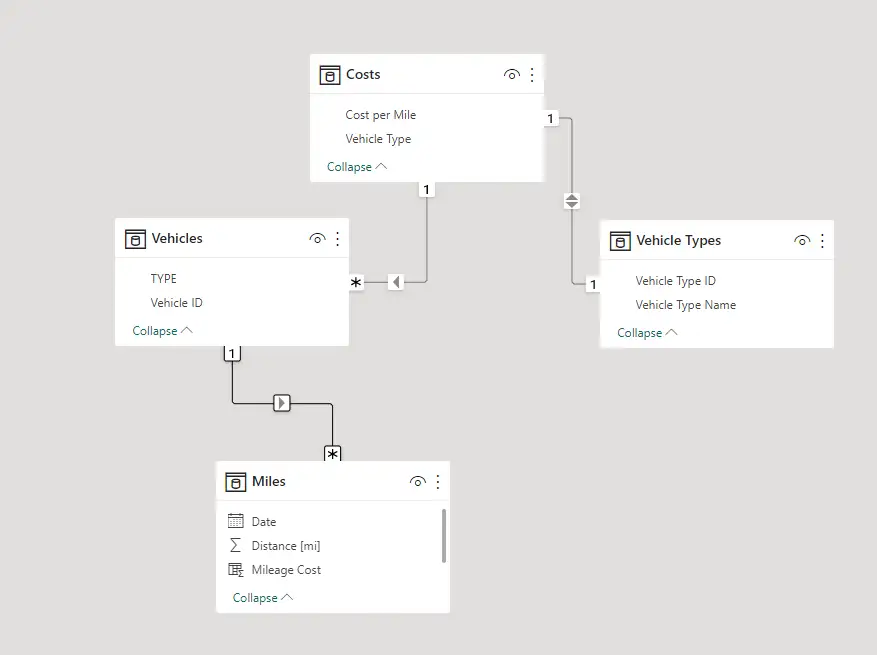
After we have loaded these data sets to Power BI, the first thing we need to do is to set the relationships
You need to set the relationships as follows
Vehicle in the Miles tables joins to the Vehicle ID in the Vehicles Table
Type in the Vehicles table joins to the Vehicle Type in the Costs Table
Vehicle Type ID in the Vehicle Types table joins to the Vehicle Type in the Costs table
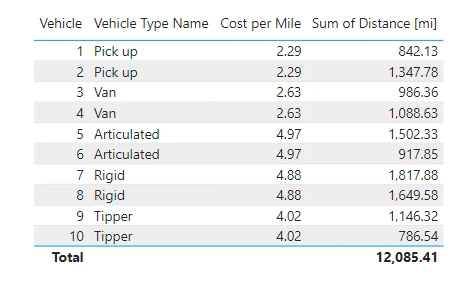
Now create a table visual on the canvas
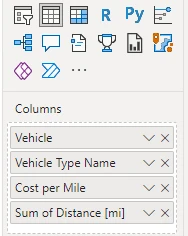
Drag a new table visual object to the canvas and bring these fields in
Vehicle from the Miles table, Vehicle Type Name from the Vehicle Types table, Cost per Mile from the Costs table and Sum of the Distance [mi] from the Miles table
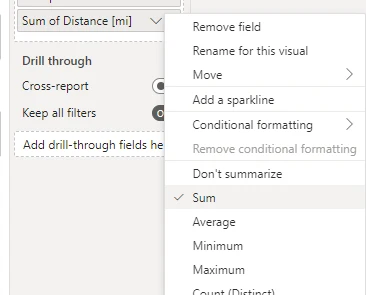
Please note: the Distance should default to using a SUM aggregation, but if not you can select the option from the chevron
Now, your table should look like this
Now add the calculated column
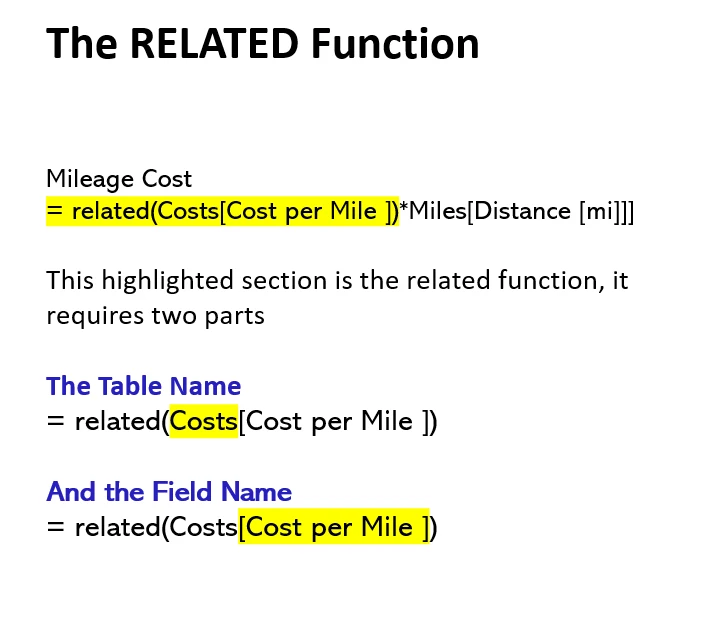
On the data pane, select the Miles table and click the New Column icon on the ribbon
Then paste in this DAX code
Mileage Cost = related(Costs[Cost per Mile ])*Miles[Distance [mi]]]

press enter and the new column is created
Power BI RELATED Function Explained
Errors to avoid with the Related Function in Power BI
The Related function only works when a single value can be returned
It cannot work if there is no clear relationship to return a single value, if a relationship returns many possible results it cannot be used, The solution there is to use RELATEDTABLE and perform a aggregation, this topic will be covered in a future post so it can be fully explained
Conclusion
The Power BI RELATED function is easy to learn, especially if you have some experience of using LOOKUPS in Excel, and can help to simplify your data modelling
There is not much to go wrong if you focus on getting the correct relationships between your tables
We hope you find this useful
Subscribe to our channel to see more tips and timesavers
Select Distinct YouTube Channel
Or find other useful SQL, Power BI or other business analytics timesavers in our Blog
Our Business Analytics Timesavers are selected from our day to day analytics consultancy work. They are the everyday things we see that really help analysts, SQL developers, BI Developers and many more people.
Our blog has something for everyone, from tips for improving your SQL skills to posts about BI tools and techniques. We hope that you find these helpful!