This quick guide shows you how to show values in rows in the matrix visual in Power BI
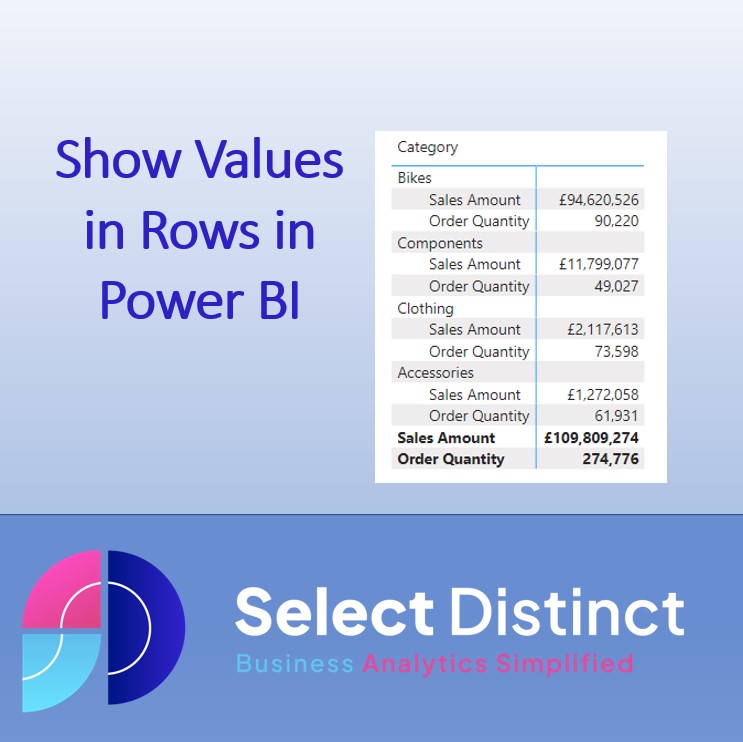
You will learn how to switch values on show in rows in a matrix, like this example
The Matrix visual in Power BI is similar to a How to create Pivot Tables in Excel, but not quite as intuitive, which can lead to many users being frustrated by an apparent lack of a way to do something which is straight forward in Excel
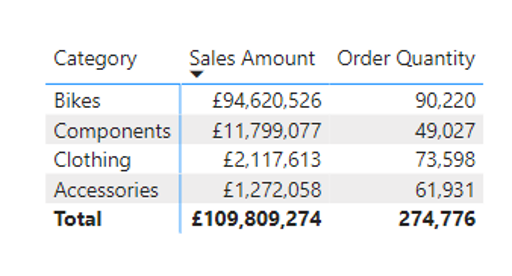
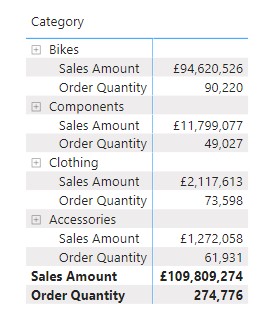
Start with a simple Matrix Visual
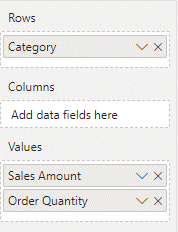
We have a simple matrix with Category set as a row
And the values aggregating for Sales Amount and Order Quantity
Now we need to apply a setting to change the positioning of the value fields
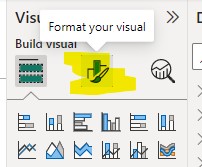
Make sure the visual is selected on the canvas by clicking on it
Then go to the Visualizations panel and click on the Format your visual icon
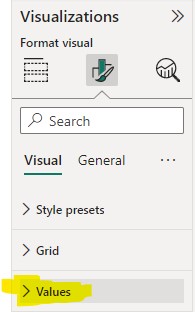
Scroll down to the Values Section and hit the chevron to expand the options
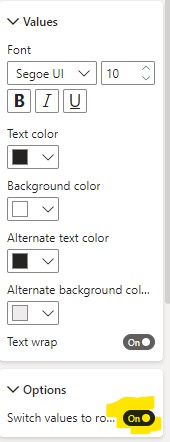
Then scroll down to the bottom of this section, and enable the option to switch values to rows option
Your matrix visual now shows values in rows
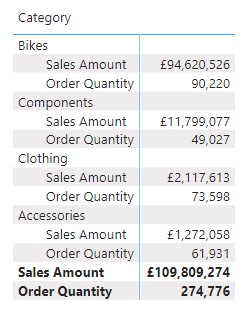
Each Value field you add to the visual will add a new measure rows within each category
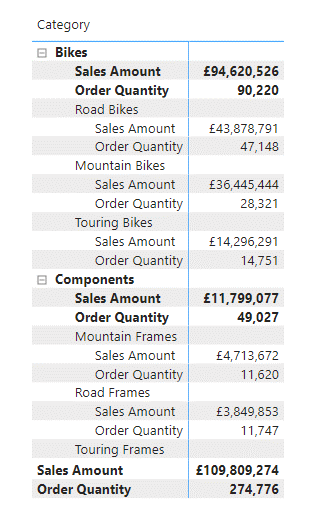
If you add a Sub Category to the rows beneath the Category the visual then shows a ‘+’ icon allowing you to expand down a level
Clicking on the plus icon expands to show the subcategories
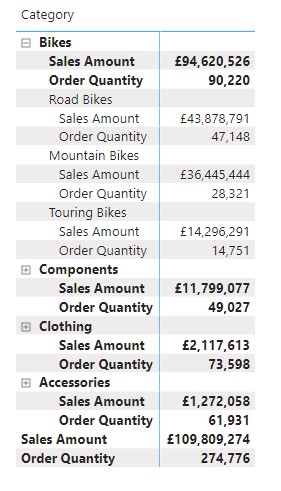
Or, you can right click on the plus icon and select expand entire level to show all of the sub categories
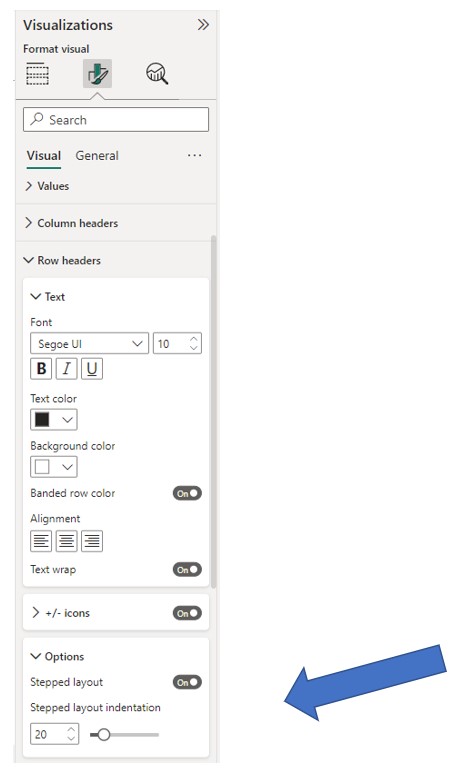
Adjust the Alignment
By Default the stepped layout indentation is not too clear
To Increase the indent, go to format visual, row headers and options
Increase the value using the slider to at least 20 to make the visual easier to read
After increasing this value to at least 20 the matrix is much clearer to read
You now know how to switch values to rows in a matrix visual in Power BI
This Power BI Tip is one of those that is not immediately apparent
We often see users who are not aware of this setting who a struggling to find the way to set the matrix up as it needs to be
We hope you find this useful
Subscribe to our channel to see more tips and timesavers
Select Distinct YouTube Channel
Or find other useful SQL, Power BI or other business analytics timesavers in our Blog
Our Business Analytics Timesavers are selected from our day to day analytics consultancy work. They are the everyday things we see that really help analysts, SQL developers, BI Developers and many more people.
Our blog has something for everyone, from tips for improving your SQL skills to posts about BI tools and techniques. We hope that you find these helpful!