Power BI Overview for Smarter Business Intelligence
Power BI by Microsoft is a powerful business intelligence tool. It allows users to transform and analyse large amounts of data in a visual and interactive way.
It provides a range of capabilities for data modelling, data visualisation, and data analysis. Making it an essential tool for organizations to make data-driven decisions.
Power BI Overview
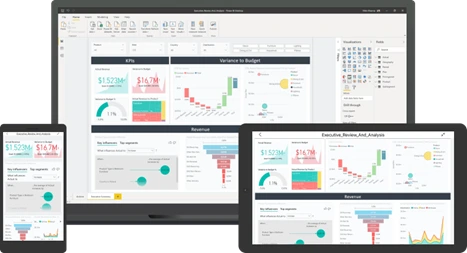
You can create visually stunning reports and share them with your organization across web and mobile platforms. With a 360-degree view of your business, everyone can customize their dashboards. Moreover, with governance and security features built-in, you can scale your data analytics across your entire enterprise with confidence.
Business Intelligence with Power BI by Microsoft
Easy to Get Started
Start Free
Download the free Power BI Desktop software
Connect your data from databases, CSV files, Spreadsheets and much much more
Work Together
With the Pro Licence you unlock the ability to publish your reports to the cloud and share with your colleagues
Where Ever You Are
With the free mobile app, you can see your data when ever and where you are
What are the components and architecture of Power BI?
Power BI is a business intelligence suite that brings together various technologies.
The Power BI architecture consists of these components
Data sources:
Places where the data is coming from.
Power Query Editor:
Tool used for data transformation.
Power BI Desktop:
Used for modelling and reporting.
Power BI Mobile:
Access your reports anywhere with Power BI Mobile for Android, iOS, and Windows.
Power Pivot:
For in-memory tabular data modelling.
Power View:
For viewing data visualizations.
Power Map:
For visualizing 3D geo-spatial data.
Power Q&A:
For natural language Q&A.
Overview of a typical Power BI Workflow
In simple terms, a Power BI user takes data from various data sources such as files, Azure source, online services, Direct Query or gateway sources. Then, they work with that data on a client development tool such as Power BI Desktop to develop reports.
To develop reports, the imported data is cleaned and transformed according to the user’s needs. Once the data is transformed and formatted, it is ready to use in making visualizations in a report.
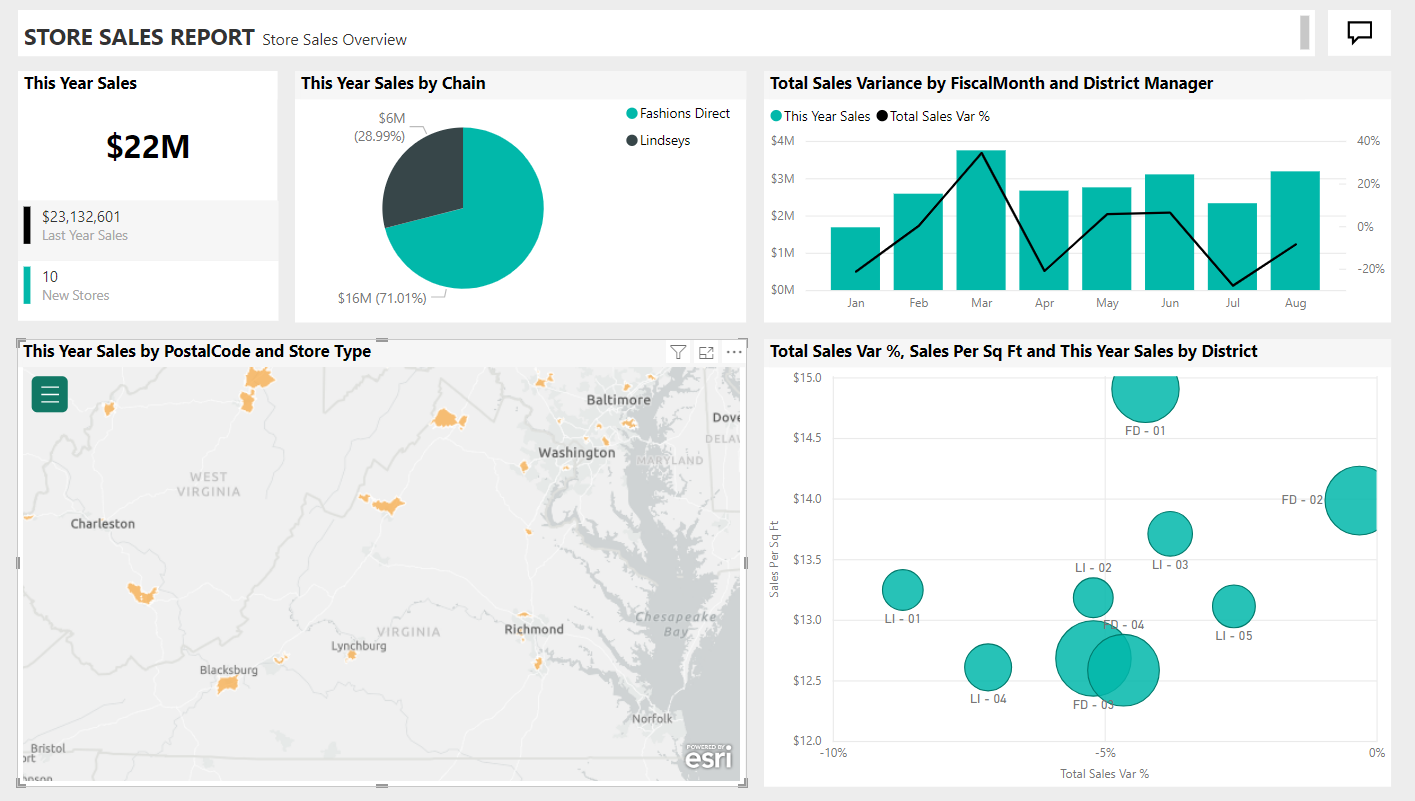
A report is a collection of visualizations like graphs, charts, tables, filters, and slicers.
You can publish the reports created in Power BI desktop on two kinds of platforms; Power BI Service and Power BI Report Server.
Power BI Service is a cloud-based platform. And Power BI Report Server is an on-premise platform
Once the reports are published, you can create dashboards on these platforms by pinning visualizations from your published reports. As such a Power BI dashboard can combine tiles made up of sections from a range of reports into a single dashboard
Share your dashboards and reports and collaborate with other users from your organization or outside. Using delivery options like a web-browser, Power BI on iPad, tablets, laptops or phones
Power BI Terminology and Concepts
Here are some of the main concepts used in Power BI
Dashboard:
A single page that displays visualizations and KPIs. These can be used to combine different snippets of data from a range of reports into a single ‘executive’ view using tiles
Report:
A collection of visualizations like graphs, charts, tables, filters, and slicers. Reports are created using Power BI Desktop
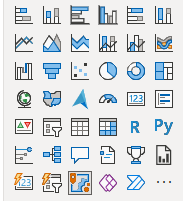
Visualizations:
Graphical representations of data, in the form of charts, tables and more
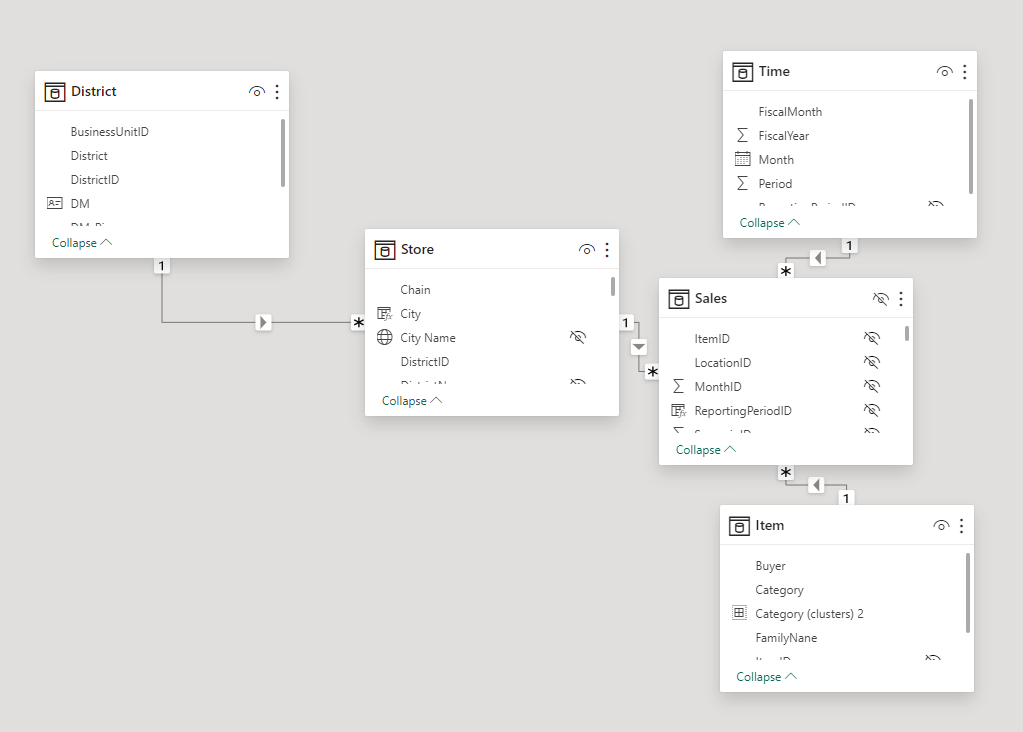
Data Model:
A collection of tables, columns, and relationships. Connecting the separate data sets together
Data Transformation:
The process of cleaning and transforming data according to the user’s needs. To get the data ready for reporting
Data Source:
A place where data is stored, such as a database, file, or web service.
Data Refresh:
The process of updating data in a report or dashboard.
Data Gateway:
A data gateway acts as a bridge between on‑premises data sources and Power BI.
Quick Insights:
A feature that automatically generates insights based on the data.
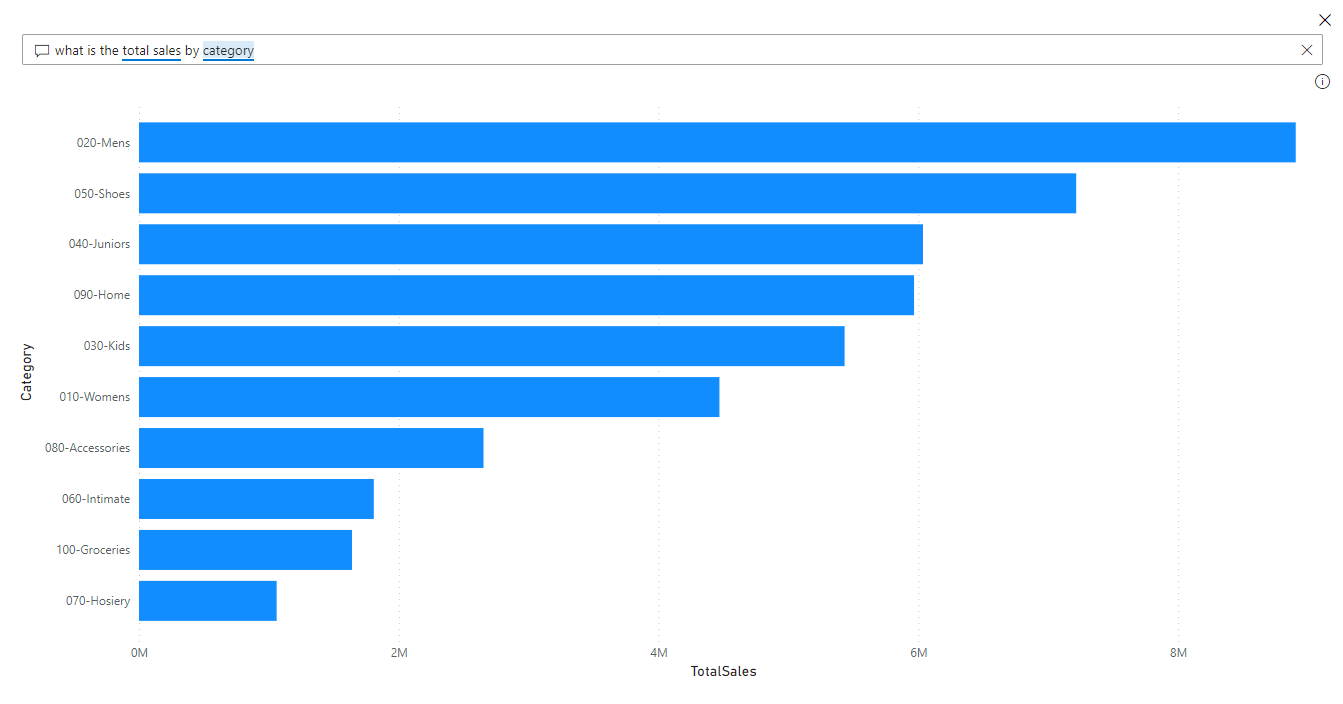
Natural Language Query:
A feature that allows users to ask questions about their data in natural language.
Power BI Pricing and Licences
Power BI offers both free and paid license options.
The free version of Power BI is called Power BI Desktop and can be downloaded for free from the Microsoft website.
If you’re comparing the Power BI Price options, it helps to understand how each licence type fits different business needs.
You can find more in our article
Summary
With Power BI, users can easily connect to various data sources, such as Excel spreadsheets, databases, and web services, to create data models that can be used to create interactive reports and dashboards. Users can also use Power Query, a data transformation and cleansing tool, to clean and reshape data before importing it into Power BI.
Once the data is imported into Power BI, users can create a wide variety of visualizations, such as charts, tables, and maps, to help them gain insights into their data. These visualizations can be customized with a range of formatting and styling options to help users create professional-looking reports and dashboards.
Expert support on hand whenever you need a little extra clarity or direction.
Frequently Asked Questions
Why is my Power BI report running slowly?
Power BI report performance is typically impacted by inefficient DAX calculations, excessive data volume in the import model, or a lack of data staging.
To improve speed, we optimise your data model by removing unnecessary columns, reducing complex DAX measures, and using an efficient data warehouse like BigQuery or SQL Server to handle transformations before the data ever reaches Power BI.
How do I decide between Power BI and other business intelligence tools
Power BI is the industry leader for organisations already within the Microsoft ecosystem, offering seamless integration with Azure, Excel, and SQL Server. However, the best tool depends on your data infrastructure.
We help you evaluate your specific requirements such as data volume, budget, and internal technical skills to decide if Power BI, Tableau, or another platform provides the best long-term value.
What is the difference between Power BI Pro, Premium, and Fabric?
Power BI Pro is designed for individual users to share reports, while Power BI Premium (or Fabric) provides larger data capacities, advanced AI features, and broader distribution options for entire organisations.
We guide you through the licensing complexity to ensure you only pay for the capacity and features your team actually needs.
How can I ensure my Power BI reports are secure?
Power BI security is managed through Row-Level Security (RLS) and Object-Level Security (OLS), which filter data based on the user's role or identity.
We implement these protocols to ensure that sensitive information remains protected, enabling you to share comprehensive dashboards safely with different departments or external stakeholders.
Can Power BI connect to non-Microsoft data sources?
Yes, Power BI connects to hundreds of data sources, including Google Analytics, Snowflake, custom APIs, and various cloud platforms.
While it connects easily to these sources, we recommend using a central data warehouse to clean and structure that data first, which ensures your Power BI reports remain fast, accurate, and consistent across all your data sources.