
Data Studio – The Re-Rebrand
Google has officially brought back the Data Studio name, finally drawing a clear line between its flexible reporting tool and the governed Looker platform. Discover what this “re-rebrand” means for your 2026 data strategy and how the new AI-driven features are changing the game.
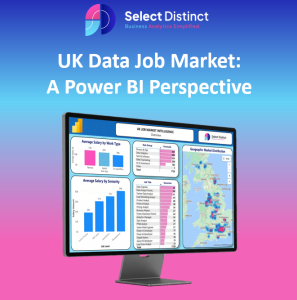
The UK Data Job Market: A Power BI Perspective
This analysis uses Power BI to map active UK data vacancies sourced from reed.co.uk, providing clear benchmarks for salaries and hiring trends. It explores the “Remote Premium,” regional growth hubs, and high-demand sectors to help professionals turn market data into actionable job leads.
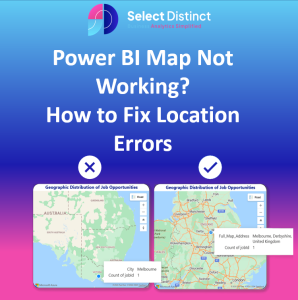
Power BI Map Not Working? How to Fix Location Errors
Fix Power BI location errors by moving beyond messy raw data to a structured geographic hierarchy. This guide demonstrates how to use AI classification and DAX “anchoring” to achieve 100% map accuracy.

Select Distinct Named a Top 20 Business Analytics Blog for 2026
The “Select Distinct” Business Analytics Blog has been recognised as one of the top 20 industry resources for 2026, highlighting its commitment to providing high-quality data insights. This accolade underscores the site’s role as an essential hub for professionals seeking to navigate the evolving landscape of business intelligence and data strategy.

Export Outlook Mailbox to Excel via Power Query
Tired of manual copy-pasting? This guide demonstrates how to use Power Query to directly connect Excel to your Outlook folders for seamless data extraction. Learn to transform messy email metadata into a clean, structured table that updates with a single click.

The Harrison Archive: 16 Years of Data, Vikings, Presidents, Royalty and an England Captain
A 16-year deep dive into the Harrison Archive. From Irish record fires to an England Captain, see how data stewardship defines our brand.