
Introduction to ROLLUP in SQL Server
Did you know that there is a simple way to add roll up sub totals in SQL Server?
SQL ROLLUP is an extension of the GROUP BY clause in SQL, providing a way to generate subtotals and grand totals for multiple dimensions within a dataset. It enables analysts to explore data at different levels of granularity, making it easier to identify patterns, trends, and relationships.
Understanding the Syntax of ROLLUP in SQL Server
The best place to start to understand the ROLLUP function is with a simple GROUP BY example.
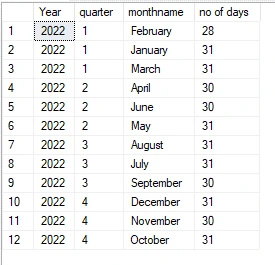
In this example we are using a date dimension table to return the number of days per calendar month:
This gives us the standard results for each month as follows
Adding the ROLLUP extension to the GROUP BY clause
The query now inserts sub total rows for each year, quarter and monthname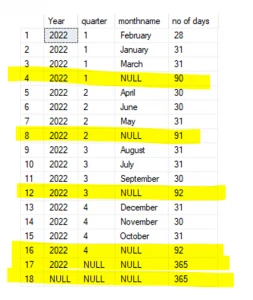
But, it does not provide labels for these subtotals, instead these have a null value
By using a coalesce function, we can easily add a relevant label
Using Partial ROLLUPS
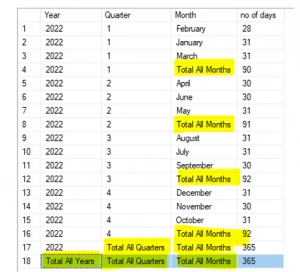
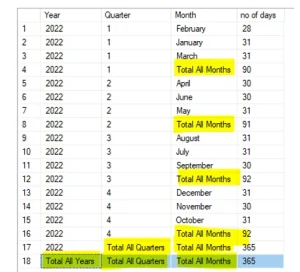
You may want to avoid generating subtotals across every column. With partial rollups, you can specify exactly which columns generate rollup values.
In this example, we calculate rollups for quarters and months only
SELECT coalesce ([Year],’Total All Years’) as [Year]
, coalesce ([quarter],’Total All Quarters’) as [Quarter]
, coalesce ([monthname], ‘Total All Months’) as [Month]
, count([date]) as [no of days]
FROM [dbo].[DimDate]
WHERE [Year] = 2022
GROUP BY [Year], ROLLUP ([quarter], [monthname])
Typical Use Cases
The flexibility of ROLLUP means it can be applied to any hierarchical dataset to instantly generate useful subtotals, without the need to write separate subqueries or window functions.
A great example is analysing retail sales data, which naturally rolls up across multiple hierarchical levels:
Region, Store, Product Category, Product
Automatically inserting subtotals across these layers saves development time and makes your SQL queries significantly easier to read and maintain.
Building or restructuring reporting models across complex database schemas?
Explore our Data Warehouse Consulting services to see how we architect high-performance analytics environments.
Important Watch-Out: Avoid Double Counting
Be careful not to double count subtotals when passing query results into downstream reporting tools (such as Power BI or Excel).
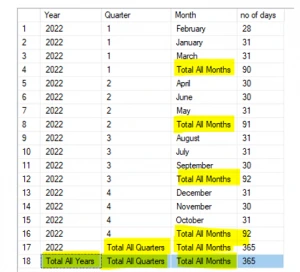
If you take a standard SUM() of the results column in the example below, it returns 1,460 days (four times the actual 365 days).
This happens because a simple column sum combines:
Individual monthly rows
Quarterly subtotals
Annual subtotals
Grand total rows
Always filter or account for subtotal rows when using these datasets in reporting layers.
Conclusion
ROLLUP in SQL Server provides a powerful, efficient way to add subtotals and grand totals to your queries. Its support for partial rollups gives you full control over where and when aggregations occur.
Beyond basic counts, you can combine ROLLUP with all standard SQL aggregation functions:
- SUM() – Total sales, quantities, or volumes across groups.
- COUNT() – Row counts across hierarchical dimensions.
- AVG()– Average performance metrics per region or period.
- MAX() / MIN()– Range boundaries across grouped sub-categories.
Give ROLLUP a try next time you need to generate multi-level summary reporting!