
Part 2 – Excel Power Pivot
How to use Power Pivot in Excel for data modelling and analysis
This follows on from our previous post How to use Power Query
What is Power Pivot in Excel
Power Pivot is a cutting-edge data modelling technology, It empowers you to create data models, establish relationships, and perform calculations with ease.
With Power Pivot, you can efficiently work with large data sets. You can build comprehensive relationships, and create both simple and complex calculations in a high-performance environment. Additionally, all of these features are available within the familiar interface of Excel. Making it easy to use for those already comfortable with the software.
Enable the Add in
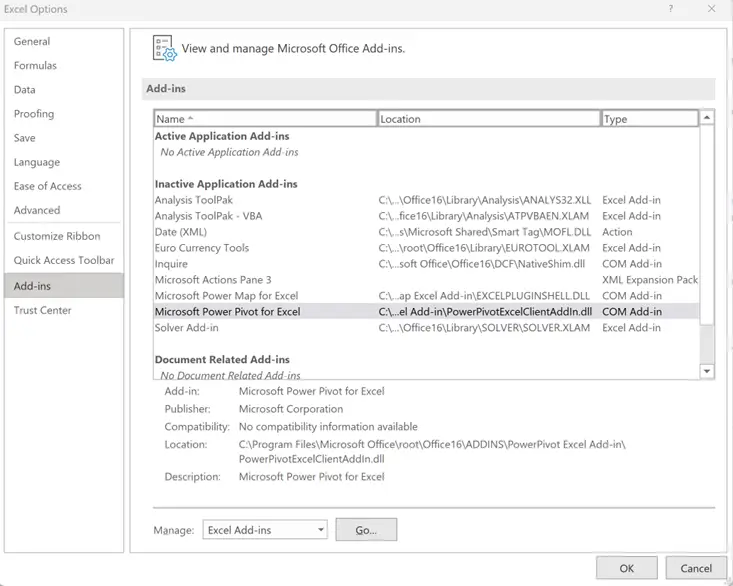
There is an add-in that needs to be added via the following:
File> Options > Add-ins
After the add-in is installed, you can start creating your data model. Then click on the “Power Pivot” tab in Excel, and select “Manage” to open the Power Pivot window.
In the Power Pivot window, you can create relationships between tables, create calculated columns and measures, and create Pivot Tables and Pivot Charts to analyse your data.
How to Access Power Pivot
Once the add-in has been added the Power Pivot menu will be added as per below.

How to Add Data to the Data Model
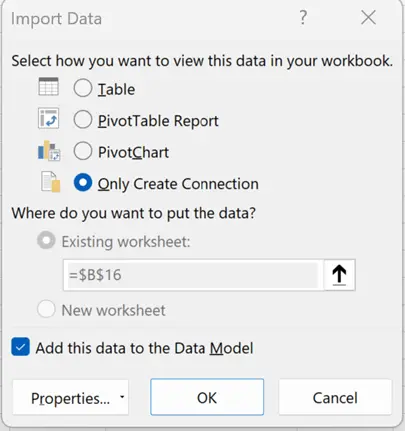
We can either use the Add to Data Model above or click the Add this data to the Data Model on the Load to menu as below.
Note it is possible to add a single source multiple times in a data model.
Power Pivot Area
Here are some of the key features
- Data view – this allows you to view the data sets
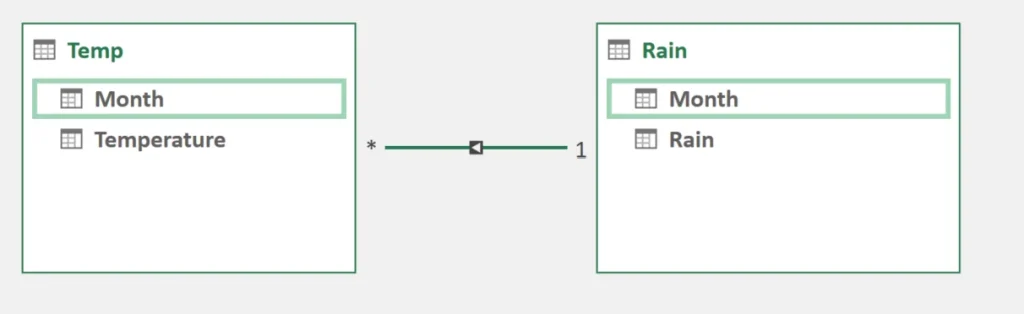
- Diagram view – you can view all the data sets and overall model. You create relationships between attributes, as per the diagram below.
- Pivot Table – output model into pivot table or chart
Measures
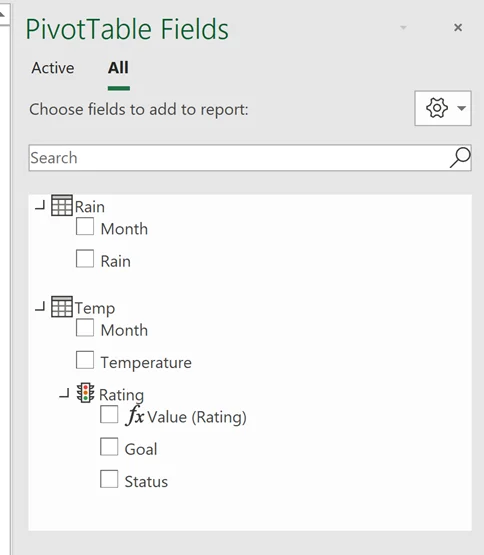
Calculations – add additional columns or DAX measures. These can be added via the Power Pivot menu
These measures can be changed to KPI’s, where targets can be set.
The Data Model
The data model acts as a pivot table as below. This offers a lot of power in any data project.
What are the advantages?
PowerPivot is a powerful data analysis tool for Microsoft Excel that enables users to quickly and easily analyse large amounts of data.
With millions of users around the world, Excel is hugely popular and flexible, adding the power of Power Pivots to this popular tool enables increased power and control
It allows users to combine multiple data sources into a single pivot table, allowing them to quickly and easily manipulate the data in order to gain insights. With PowerPivot, users can quickly and easily filter, sort, group, and summarize their data so that they can make better decisions about their business.
Using its easy-to-use interface that allows even novice users to become proficient in using the tool for their own analysis needs. With its ability to rapidly analyse large amounts of data, PowerPivot is becoming increasingly popular among businesses looking for a more efficient way of analysing their data.
Watch our You Tube video
Subscribe to our channel to see more Excel tips and timesavers
Select Distinct YouTube Channel
You may be interested in How to use Power Query
Explore more guides in the Business Analytics Blog