How to use Power Query and Power Pivot for data modelling and analysis
Whilst Power BI is known for its advanced data modelling and ability to transform data. You may not know that many of these functions are available in Excel.
These Blogs aim to give you the knowledge or skills to use these, namely Power Query and Power Pivots.
Part 1 – How to use Excel’s Power Query
What is Power Query?
Power Query is a versatile business intelligence tool that is available in Excel, enabling you to import data from various sources and perform data cleaning, transformation, and reshaping. One of its most significant advantages is that you can set up a query once and reuse it with a simple refresh, which can import and clean millions of rows into the data model for analysis.
Power Query’s user interface is well-designed, making it easy to learn, even for those without prior experience using formulas or VBA. The best part is that you don’t need to learn any code to use it. The Power Query Editor records all your transformations step by step and converts them into the M code for you, which is similar to how the Macro recorder works with VBA. We aim to cover off the basics in this blog to get you started.
Where to Find Power Query
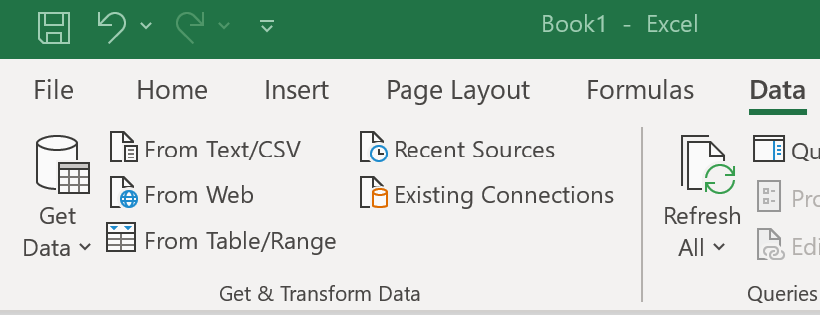
Power Query now known as Excel Get & Transform, it consists of 4 stages. Connect, Transform, Combine and Load. In Excel 2010 and 2013 it is available as an add-in, in 2016 onwards it appears in the data tab as shown below.
Connect
Simply Press the Get Data drop down and see what you can connect data to. Sources include external files, databases or sources such as salesforce, adjacent buttons also allow you can also add data from files or from the current workbook with From Table/Range button.
Once set the data can be refreshed when required.
Transform
The real power is the transform area which is found in the Power Query editor. This can be found under the Get Data button by pressing Launch Power Query Editor or when you add data to Power Query. The editor can be seen in the screen shot below, from here you can transform the data to fit your requirements.
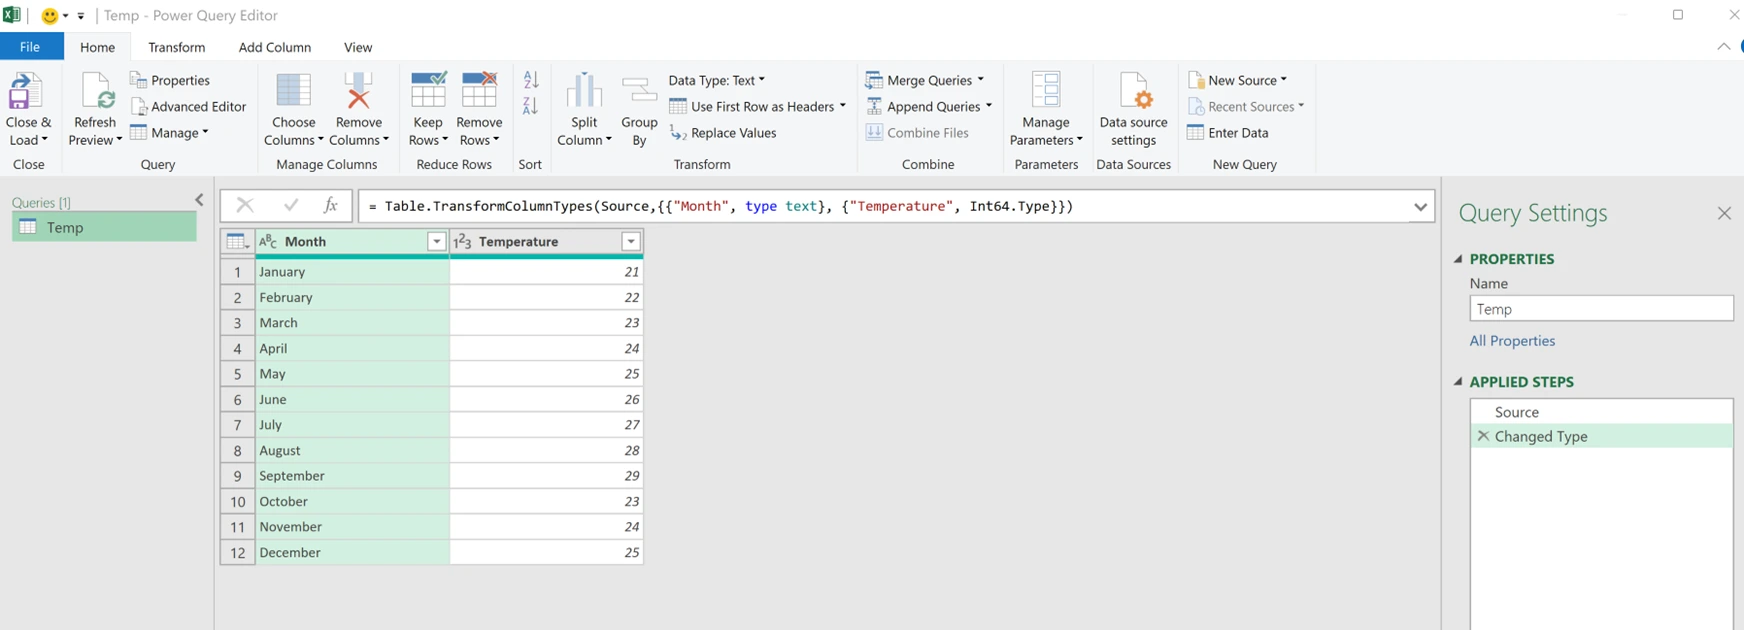
There are multiple transforms available each of these steps is recorded and repeatable. The transforms include basic changes such removing or renaming columns, choosing data types or more complex such as pivot and unpivot data.
The steps you undertake are found in the Applied Steps section each of these are recorded and can be reviewed.
The recorded steps are also captured within the Power Query M-Language, which you review, modify or add to steps in the advanced editor.
Combine
You can combine multiple queries in your workbook, the main methods are to Append or Merge the data. Append is similar to union all, merge is similar to a join. For example you can also use these to merge multiple files in a folder.
Load
The main ways to load the data into your workbook are below:
- From Power Query Editor you can Close & Load or Close & Load To
- From the Excel Work Books Queries pane (Select Queries & Connections), right click a query and select Load To.
This allows the data to be loaded to a tab or data model.
In part 2 of this 2 part blog post we will show you how to use Power Pivot
Watch our video to see more
Subscribe to our channel to see more tips and timesavers
Select Distinct YouTube Channel
Or find other useful SQL, Power BI or other business analytics timesavers in our Blog
Our Business Analytics Timesavers are selected from our day to day analytics consultancy work. They are the everyday things we see that really help analysts, SQL developers, BI Developers and many more people.
Our blog has something for everyone, from tips for improving your SQL skills to posts about BI tools and techniques. We hope that you find these helpful!