The basic Top N filter in Power BI can be very useful. But if you need to show the values of the whole you will need to use an advanced Top N Filter Measure
This guide shows you how you can set it up
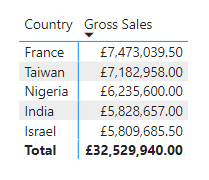
If you use the standard top N filter you would see something like this
We outlined how this works in this post
TOPN in Power BI – Select Distinct
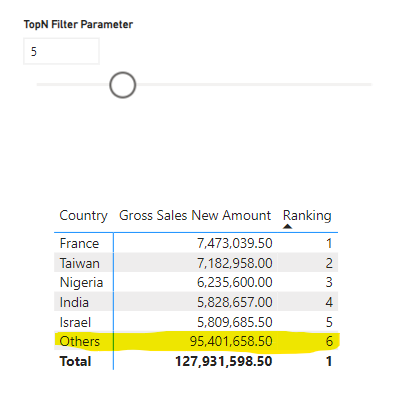
The problem with this method is that it ONLY shows the values for the top 5, but quite often you need to show the whole value with an aggregate row showing the ‘other’ values
We want the users to be able to use a slicer to select how many of the Top N values to see, but to also show the balance as ‘Others’
This type of dynamic grouping is a frequent requirement in the executive dashboards we build at our Power BI consultancy. If your reporting needs require this level of advanced DAX architecture, our experts can help.
Overview of the steps involved
Detailed steps
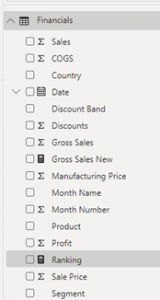
1.Ensure there is a measure value for the ranking
You may have a measure already, but if not create one
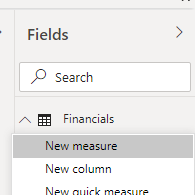
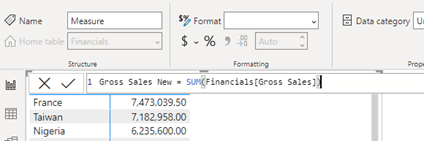
For illustration we are creating a measure called ‘Gross Sales New’ as the sum of the Gross Sales field
DAX Code
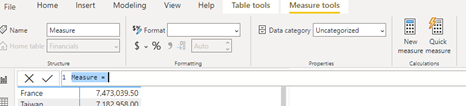
Gross Sales New = SUM(Financials[Gross Sales])
paste this code over where it says Measure =, this creates the new measure
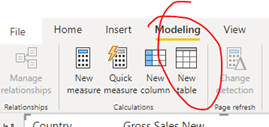
2. Create a new table to determine the values for other
Use this DAX code to create the new table
TopN Names =
UNION
(ALLNOBLANKROW( Financials[Country]),
{“Others”}
)
This creates a new table in the Fields Pane
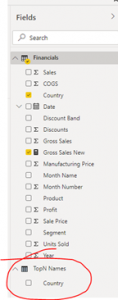
This table contains all the values in the matrix, plus ‘Other’ as the last row
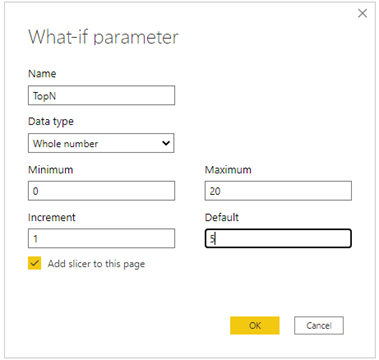
3. Now Create a parameter to set the number of top rows to show
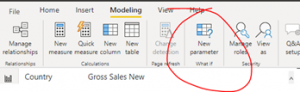
In the new parameter dialog enter as follows:
Name >> TopN
Data Type >> Whole Number
Min >> 0
Max >> 20 (Optional, TopN results required)
Increment >> 1 (Usually, may be different)
Default >> * (Optional)
Add Slicer >> Tick (Optional, will show slicer on report)
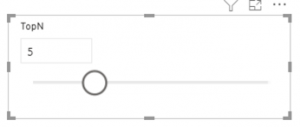
This creates a new Parameter table
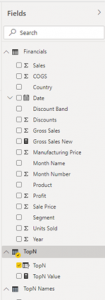
And slicer for the users to select a value for the Top N
4. Add a new measure to the Financials Table
This applies a ranking to all values in the rows, including others, based on the measure.
Right click Financials, select New measure, then replace contents of code box with
Ranking =
VAR CatToRank = [TopN Value]
VAR Ranking =
RANKX (
ALLSELECTED(‘TopN Names'[Country]),
[Gross Sales New]
)
VAR IsOtherSelected =
SELECTEDVALUE(‘TopN Names'[Country]) = “Others”
VAR Result =
IF (
IsOtherSelected,
CatToRank + 1,
IF ( Ranking <= CatToRank , Ranking, ranking + 1)
)
Return
Result
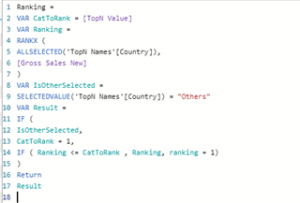
This creates a new measure called Ranking in the Financials table
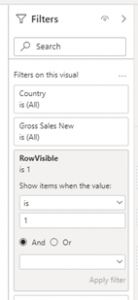
5. Make the rows visible if their rank is within the Top N results
Create another measure with this code
RowVisible =
VAR Ranking = [Ranking]
VAR TopNValue = ‘TopN'[TopN Value]
VAR Result = INT( Ranking <= TopNValue + 1)
Return
Result
Compute a value for ‘Others’
Add a new measure to the Financials table.
Paste the following into the code box.
Gross Sales New Amount =
VAR NewMeasureAll =
CALCULATE( [Gross Sales New], REMOVEFILTERS(‘TopN Names'[Country]) )
RETURN
IF (
ISINSCOPE(‘TopN Names'[Country] ),
VAR TopNToRank = [TopN Value]
VAR IsOtherSelected = SELECTEDVALUE(‘TopN Names'[Country]) = “Others”
VAR TopNWithMeasure =
ADDCOLUMNS(
ALLSELECTED(‘TopN Names'[Country]),
“@amt” , [Gross Sales New]
)
VAR TopNCat = TOPN( TopNToRank, TopNWithMeasure, [@amt] )
VAR TotalTopN = SUMX( TopNCat,[@amt] )
VAR Result = IF ( IsOtherSelected, NewMeasureAll – TotalTopN , [Gross Sales New])
RETURN Result ,
NewMeasureAll
)
This creates a new measure which is used in place of the original. This is necessary as the
total of “Other” results has to be recalculated when the TopN value changes.
Filter and Sort Results
Enable “Other” values by Joining TopN Names table to the Financials table.
Open the Model window using the bottom icon in the left menu
Create a connection (Join) between the two Country objects
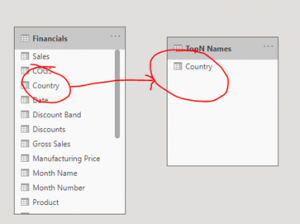
Drag the Country item in Financials to the Country item in TopN Names
This creates a join between the two tables wherever the Country Field is used.
Check the properties of the join. Right click on the arrow in the join connector, select Properties
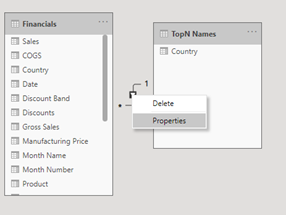
Ensure the following settings are correct:
Cardinality >> Many to One
Cross Filter Direction >> Single
Make this Relationship Active >> Ticked
Filter to show only TopN and Other
As it stands the Matrix is showing the original values, and all values. The Row Visible measure can be used to filter as only TopN and Other
Ensure the Matrix is selected.
Drag Row Visible item from Fields Pane to the Add Data field in the Filter Pane
Change the Show Items drop down to ‘IS’
Add ‘1’ to the value box
Click Apply Filter
The values in the Matrix should change to show only the TopN values. (If a Row item is not in the TopN, the Row Visible value will be 0. Remember, the Other item is not yet showing.)
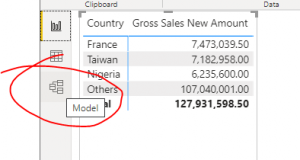
Include the new values in the Matrix
Swap Gross Sales New measure for the Gross Sales New Amount in the Visualisations Pane, Values box
This changes the values in the Matrix. Note ‘Other’ is now shown.
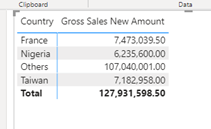
By default this is sorting the values by country ascending, we want the values to sort descending, but with the ‘others’ to always be last
Add Ranking to the Values of the Matrix
We add the ‘Ranking’ measure into the matrix
Order the Ranking values Ascending. Click on the column header in the matrix until the Arrow points up and the ranking is from 1 upwards.
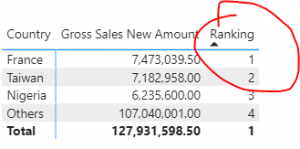
You now have an Advanced Top N Filter in Power BI
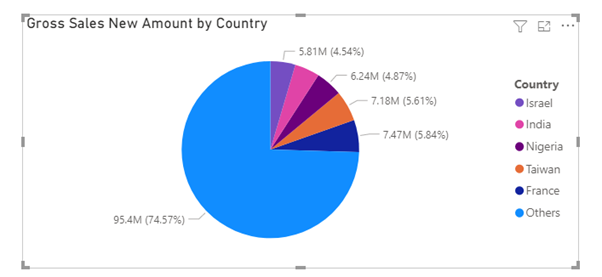
This technique is applicable to other visualisations.
For example, duplicate the Matrix and change type to Pie Chart. This example clearly shows the top 5 as representing around a quarter of the whole, with ‘Others’ showing the majority
In this case we do not need Ranking, it can be removed
Conclusion
Learning how to create this Advanced Top N Filter in Power BI is a little complex, but worth persevering with.
Having the option to select the Top N value using a slicer in Power BI is a great way to allow the user to interact with the data
https://www.youtube.com/watch?v=furpnzhWNAQ
Subscribe to our channel to see more tips and timesavers
Select Distinct YouTube Channel
Refine your reporting logic:
Explore more advanced techniques in Dashboard Design & BI Tools and Data Analytics & Business Intelligence.
For broader context, visit our Business Analytics Blog and explore how filtering fits into the analytics process

Book a FREE Power BI Consultancy meeting
If your reporting requirements go beyond Top N filters, our Power BI Consulting can help you architect advanced DAX measures and professional-grade data models for executive-ready dashboards.
Book a 30-minute FREE Teams call with Simon Harrison to discuss your specific business goals and ensure your Power BI setup is optimised for growth without unnecessary overhead.
One Response