
Understanding TOP N in Power BI
You have heard of the 80:20 rule (Pareto)?
In the world of data analysis, having the ability to efficiently rank and prioritize information is crucial. This is where the TOP N function in Power BI comes into play. By utilizing this powerful ranking function, analysts and data professionals can gain valuable insights from their datasets.
The TOP N function, short for “top n,” allows users to identify and retrieve the top or bottom records based on a specified criteria. This function is particularly useful when dealing with large datasets that require quick and accurate analysis.
With Power BI’s extensive capabilities, the TOP N function can be utilized through its native DAX (Data Analysis Expressions) formula language. By incorporating this formula into your Power BI reports and dashboards, you can effectively sort and filter data to highlight key trends, outliers, or patterns.
The importance of the TOP N function lies in its ability to streamline decision-making processes by presenting relevant information in a concise manner. Whether you are analysing sales figures, customer satisfaction ratings, or any other dataset, being able to quickly identify the top performers or underperformers can greatly impact strategic decision-making.
In this section, we will delve deeper into understanding how the TOP N function works within Power BI and explore real-world use cases where it can be applied effectively. So let’s dive in and unlock the full potential of this essential feature in Power BI!
The basic Top N filter in Power BI
Power BI has a built in Top N filter as one of its standard features
Here is a very simple example
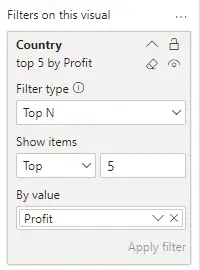

This is all well and good, but what if you want to see how much of the whole these top 5 represent?
The Top N filter is useful, but it does not answer this kind of question
We will show you a more powerful way to achieve this
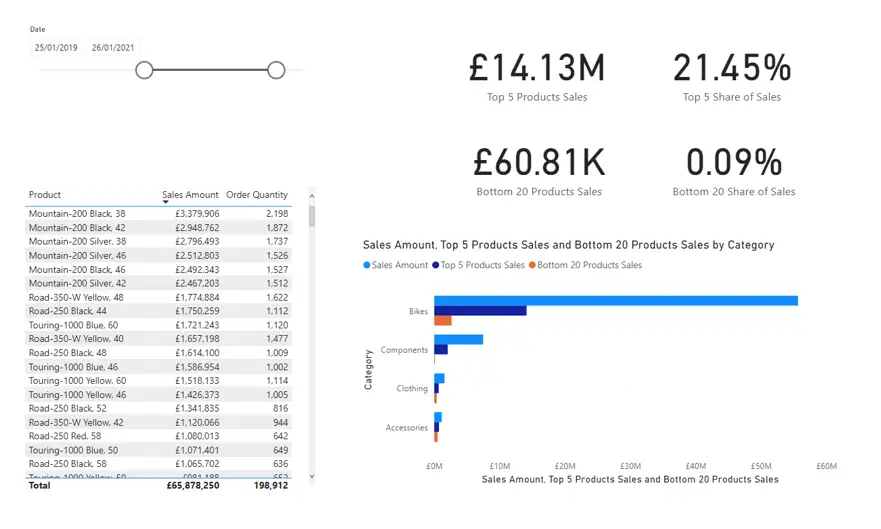
How to use the TOP N function in Power BI
We want to show a report with some simple metrics showing how significant the top 5 products are in terms of sales share
For Example
This is done using the DAX TOP N function
Step 1 is to create a measure to aggregate sales for the top 5 products
VAR TopNProducts =
TOPN (
5,
SUMMARIZE(Sales, ‘Product'[Product],”SALESVALUE”,sum(Sales[Sales Amount])),
[SALESVALUE],desc
We create a Variable to identify the top 5 products, and a separate variable to aggregate the sales amount
VAR Result =
CALCULATE (
SUM(Sales[Sales Amount]),
TopNProducts
This makes the DAX easier to read
Top 5 Products Sales =
VAR TopNProducts =
TOPN (
5,
SUMMARIZE(Sales, ‘Product'[Product],”SALESVALUE”,sum(Sales[Sales Amount])),
[SALESVALUE],desc
)
VAR Result =
CALCULATE (
SUM(Sales[Sales Amount]),
TopNProducts
)
RETURN Result
Breaking down the syntax
SUMMARIZE creates subtotals, in this case a column with each ‘Product’
and a second column for the total sales
SUMMARIZE(Sales, ‘Product'[Product],”SALESVALUE”,sum(Sales[Sales Amount]))
TOP N – The ‘5’ sets how many top rows to return
We use the summarise row to define the data rows (see above)
The last row defines the field to sort by (SALESVALUE in Descending order)
TOPN (
5,
SUMMARIZE(Sales, ‘Product'[Product],”SALESVALUE”,sum(Sales[Sales Amount])),
[SALESVALUE],desc
We now have a new measure we can drag onto the visuals on the canvas
We also repeated if to create a bottom 20 products too

The measure responds to the date slicer and gives us exactly what we needed
Conclusion
Having the ability to focus on the top few drivers of performance the TOPN function is a powerful way to eliminate noise from insignificant items
TOP N in Power BI is easy to learn and apply once you understand the syntax
Keep an eye out for the more advanced use of this with an amendable parameter in the coming weeks
Subscribe to our channel to see more tips and timesavers
Select Distinct YouTube Channel
Or find other useful SQL, Power BI or other business analytics timesavers in our Blog
Our Business Analytics Timesavers are selected from our day to day analytics consultancy work. They are the everyday things we see that really help analysts, SQL developers, BI Developers and many more people.
Our blog has something for everyone, from tips for improving your SQL skills to posts about BI tools and techniques. We hope that you find these helpful!