
From Warehouse to Dashboard
Ever tried to calculate how many full pallets you can fill with boxes, and how many are left over?
The key solution to this is by using QUOTIENT() and MOD() in Power BI to break down totals into usable units.
By calculating this it can help multiple areas, such as inventory planning, logistics, and operational efficiency.
Case Scenario:
For instance, you have a business which is operates in the logistics industry:
- You have a total number of boxes
- Each pallet holds a fixed number of boxes
You want to calculate:
- Number of full pallets
- Number of leftover boxes
Example: 1,250 boxes, 48 boxes per pallet
| Shipment ID | Product | Total Boxes | Boxes per Pallet |
| S001 | Widget A | 1250 | 48 |
Step by Step walkthrough of quotient and MOD in Power BI
If you want to follow along with this example, start with this dataset
| Shipment ID | Product | Total Boxes | Boxes per Pallet |
| S001 | Widget A | 1250 | 48 |
| S002 | Widget B | 960 | 60 |
| S003 | Widget C | 1005 | 50 |
| S004 | Widget D | 2300 | 72 |
| S005 | Widget E | 875 | 40 |
Step 1: Using the data provided (or your own dataset), select ‘enter data’ on Power BI and paste this into the table
Step 2: Create a calculated column or measure for
FullPallets =
QUOTIENT([TotalBoxes],[BoxesPerPallet])
Copy and paste this DAX into Power BI
| Shipment ID | Product | Total Boxes | Boxes per Pallet | Full Pallets |
| S001 | Widget A | 1250 | 48 | 26 |
| S002 | Widget B | 960 | 60 | 16 |
| S003 | Widget C | 1005 | 50 | 20 |
| S004 | Widget D | 2300 | 72 | 31 |
| S005 | Widget E | 875 | 40 | 21 |
Step 3: Create another calculated column or measure for
LeftoverBoxes =
MOD([TotalBoxes],[BoxesPerPallet])
Copy and paste this DAX into Power BI
| Shipment ID | Product | Total Boxes | Boxes per Pallet | Full Pallets | Leftover Boxes |
| S001 | Widget A | 1250 | 48 | 26 | 2 |
| S002 | Widget B | 960 | 60 | 16 | 0 |
| S003 | Widget C | 1005 | 50 | 20 | 5 |
| S004 | Widget D | 2300 | 72 | 31 | 68 |
| S005 | Widget E | 875 | 40 | 21 | 35 |
Step 4: Add visuals: KPI cards, matrix or bar charts
Power BI Dashboard Example:
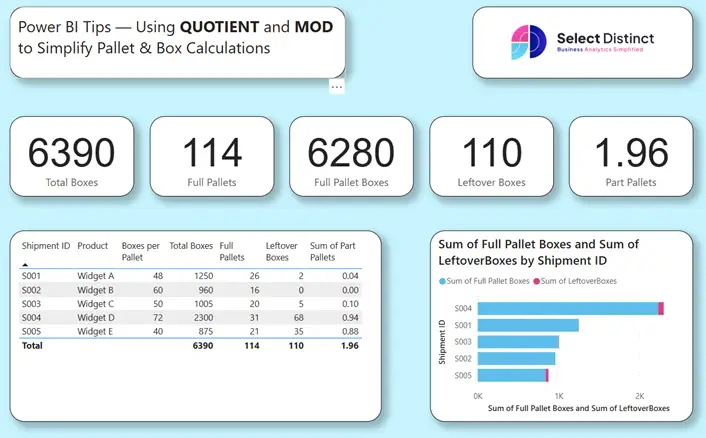
Adding visuals to the dashboard such as KPI Cards, bar chart and a matrix can provide clearer insights for businesses.
Why It Works?
- Operational Insight: Helps warehouse teams plan shipments, assigning delivery slots or rotating shifts
- Business Impact: Reduces overpacking, improves space utilisation
- These functions are fast, intuitive, and easy to explain to non-technical user
Other Use Cases:
- Packaging – Units per container
- Time Tracking – Hours and minutes
- Budgeting – Full payments vs remainder
Final Thoughts: Small Functions, Big Impact
Ready to apply this to your own data?
Explore our Power BI Glossary to decode functions like QUOTIENT and MOD
Dive into more How-To Guides for everyday reporting fixes