

Published: September2025 | Last Updated: October 2026
A Profit & Loss (P&L) report is one of the most important financial reports for understanding business performance. In this guide, we’ll show you how to use Xero data to create an interactive Profit & Loss report in Power BI. This is just one example of how Data Analytics for Accounting can help finance teams gain deeper insight into revenue, costs and profitability.

Benefits of Creating a Profit & Loss Report in Power BI
- Analyse profit, revenue and expenses across multiple periods
- Compare monthly, quarterly and annual financial performance
- Drill from summary figures into individual account transactions
- Automate refreshes from Xero to reduce manual reporting effort.
- Create interactive dashboards for management and stakeholders
Data Required for a Power BI Profit & Loss Report
To build a Profit & Loss (P&L) report in Power BI, you’ll need two exports from Xero:
- Account Transactions – provides the underlying financial transactions.
- Chart of Accounts – provides the account structure and reporting categories.
Together, these datasets allow you to create a dynamic Profit & Loss statement with drill-through capabilities, period comparisons and automated reporting.
Exporting Account Transactions from Xero
The Account Transactions report contains all income and expenditure transactions that feed your Profit & Loss statement.
Step 1: Navigate to the Account Transactions Report
- Log into Xero and select the company
For this guide, we will be referring to the Demo Company (UK) - Locate to the Reporting tab and select Account Transactions
- The below should be displayed as:
• Accounts: Select all accounts
• Date Range: This Financial Year (adjust accordingly)
• Columns: 12 Columns selected
• Grouping/Summarising: Group By: Account Code & Name
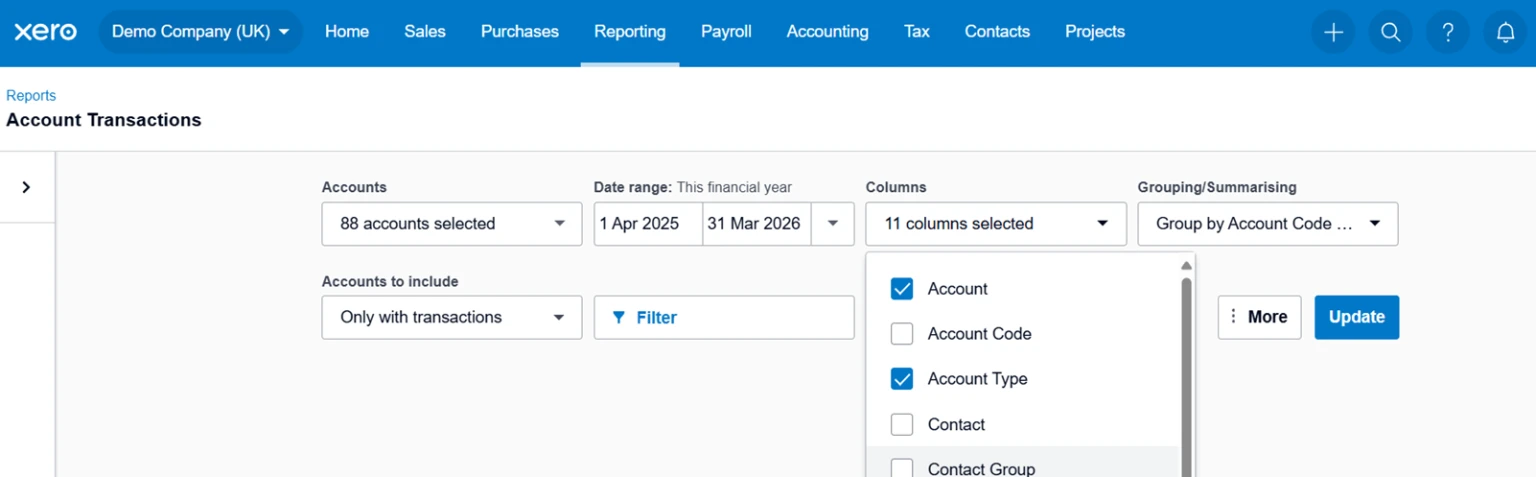
- Re-order columns to your preference
Here is the example of columns which has been used to extract the data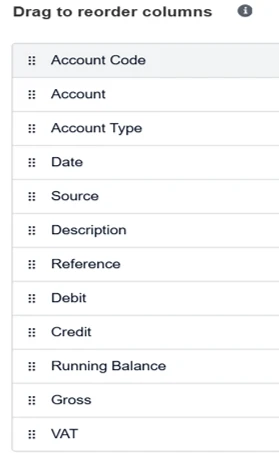
- Export the report and save the file as an Excel Workbook
Exporting the Chart of Accounts from Xero
The Chart of Accounts provides the structure behind your Profit & Loss report in Power BI. It contains the account names, account codes and reporting categories needed to group transactions correctly and build an accurate P&L statement.
Step 2: Export the Chart of Accounts
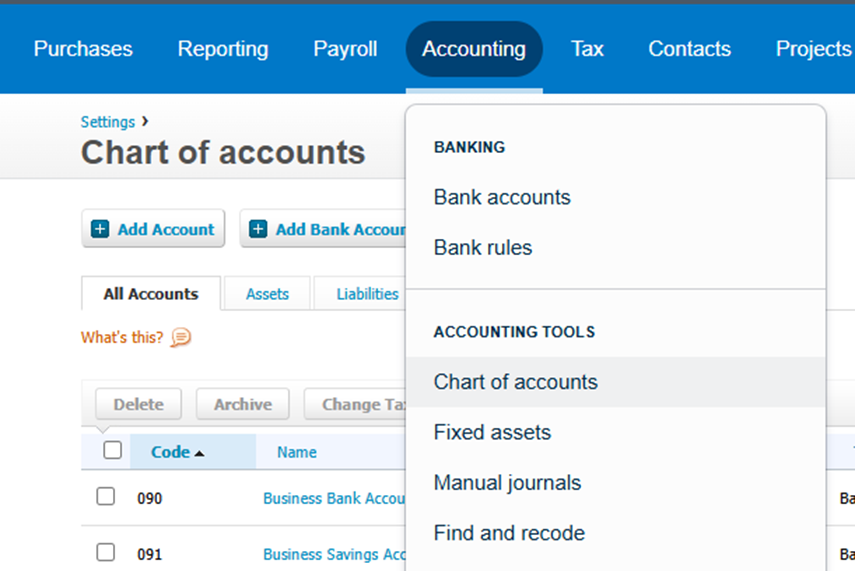
- Navigate to Accounting in Xero
- Select Chart of Accounts.
- Export the Chart of Accounts to Excel.
- Save the file ready for import into Power BI.
Importing Xero Data into Power BI
With the required Xero reports exported to Excel, the next step is to load the data into Power BI ready for modelling and Profit & Loss reporting.
Step 3: Import the Account Transactions and Chart of Accounts Files
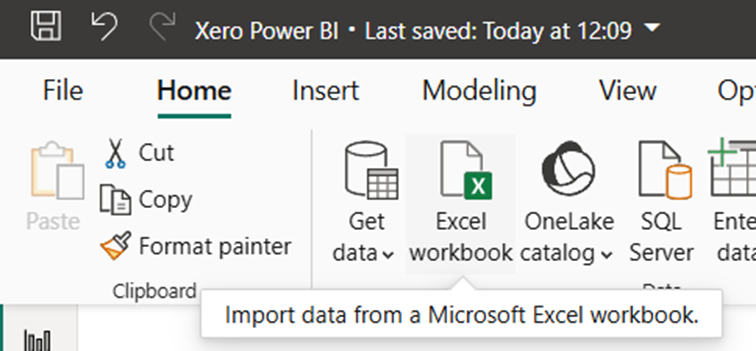
- Open Power BI Desktop and select Get Data.
- Choose Excel Workbook and select the Account Transactions export.
- Select Load to import the data.
- Repeat the process for the Chart of Accounts export.
- Confirm both tables are visible within the Power BI data model.
Preparing the Xero Data for Profit & Loss Reporting
Before building the Profit & Loss report, the exported Xero data needs to be cleaned and structured in Power Query.
This ensures transactions are analysed correctly and prevents headers, blank rows and summary records from affecting your financial reporting.
Clean the Account Transactions Data
The Xero export contains report formatting that is useful in Excel but not suitable for analysis in Power BI.
To create a clean reporting table:
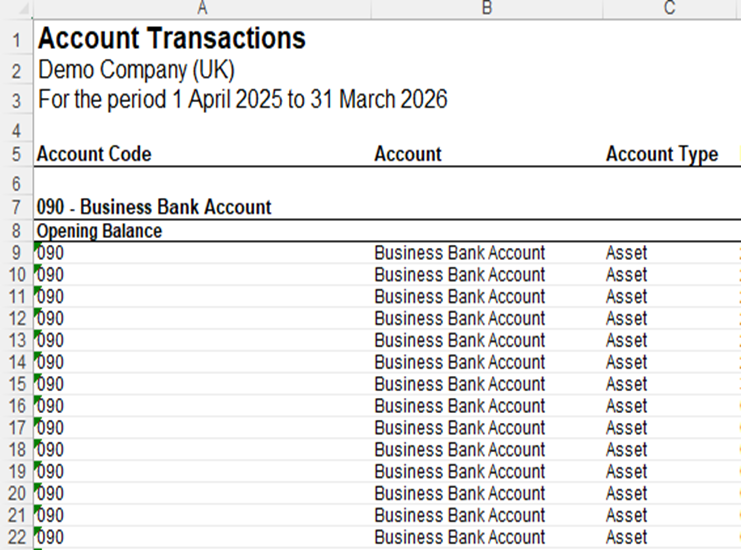
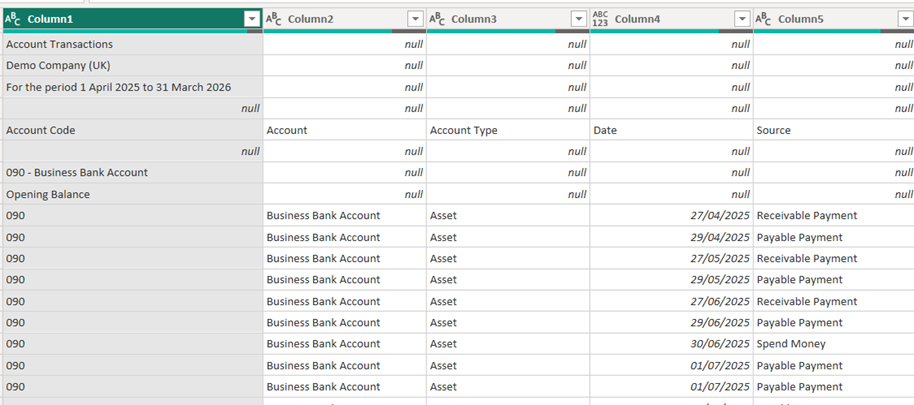
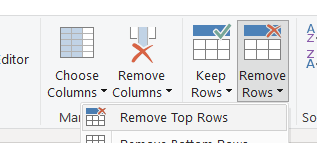
Step 1: Remove Report Header Rows
Remove the first four rows from the dataset.
These contain report titles and metadata that are not required for reporting.
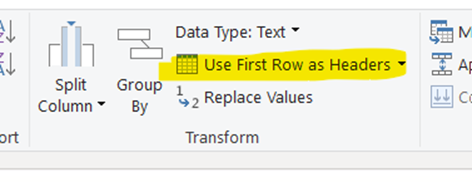
Step 2: Promote the First Row to Headers
Use First Row as Headers to convert the column names into a usable table structure.
Step 3: Remove Blank Rows
Filter out empty rows to ensure the dataset only contains transaction data.
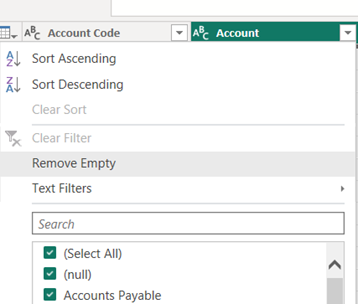
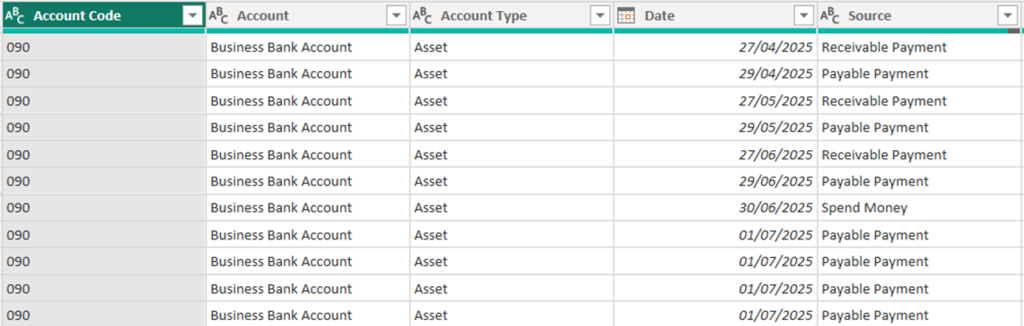
You should now have a clean transaction table with consistent column headers, no blank rows and one record per transaction.
This table is ready to be used within your Power BI data model and Profit & Loss report.
Step 5: Create the Power BI Data Model
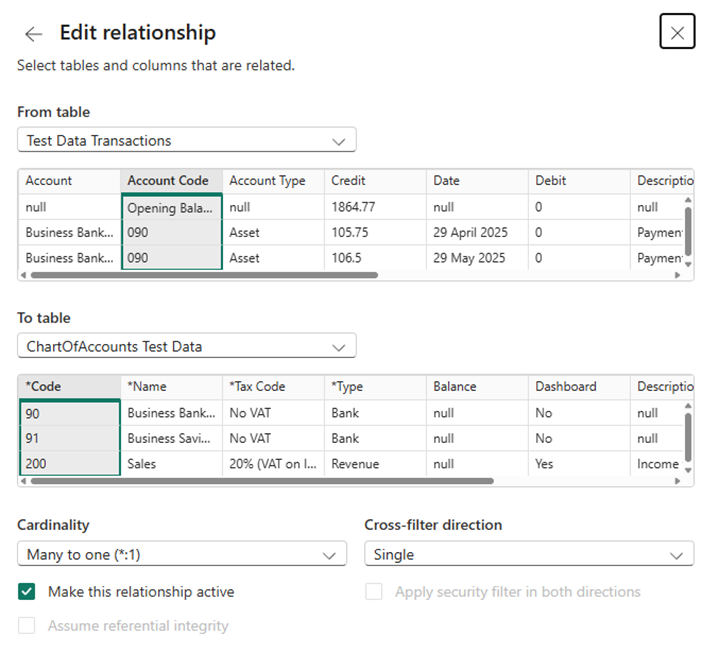
With both Xero datasets imported and cleaned, the next step is to create a relationship between the Account Transactions table and the Chart of Accounts table.
Create the Relationship
- Open Model View in Power BI.
- Select Manage Relationships and choose New Relationship.
- Connect the Account Code field in the Account Transactions table to the Account Code field in the Chart of Accounts table.
- Configure the relationship as:
- Cardinality: Many-to-One (*:1)
- Cross-filter direction: Single
- Select OK to create the relationship.
Making Profit & Loss Values Easier to Understand
With the data model in place, we can improve how financial data is presented in Power BI.
In accounting systems such as Xero, revenue is typically recorded as a credit (negative value), while expenses are recorded as debits (positive values). Whilst this makes sense from an accounting perspective, it can be confusing for management reporting and business users.
For a Profit & Loss report, most stakeholders expect to see:
- Sales and income as positive values
- Expenses and costs as negative values
- Profit displayed as a positive figure when performance is strong
To achieve this, we will create a calculation that adjusts values based on the account type, producing a more intuitive and easier-to-read Profit & Loss statement.
Ensure that the Account Code Column and Code Column is selected for you to create this relationship

Step 6: Creating a column to calculate the value:
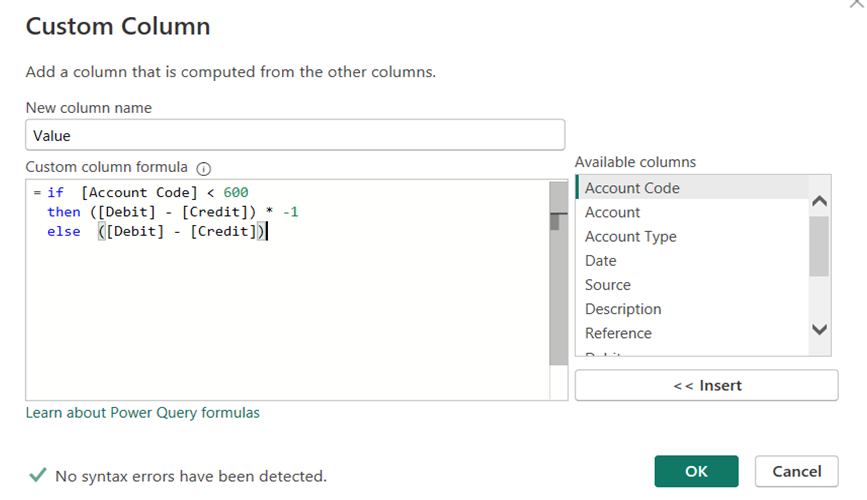
The data imported from Xero follows standard accounting conventions, where income is typically recorded as credits and expenses as debits. For management reporting, it is often easier to present income as positive values and expenses as negative values.
To achieve this, we’ll create a calculated column that converts the source data into a format that is easier to analyse in a Profit & Loss report.
Create the Calculated Column
- Open Table View in Power BI.
- Select the Account Transactions table.
- Choose New Column from the Table Tools menu.
- Name the new column Value.
Step 7: Organising account type sort order:
A standard alphabetical sort order rarely produces a meaningful Profit & Loss or Balance Sheet layout.
To present financial information in the correct order, create a dedicated sort table that controls how account types are displayed within Power BI.
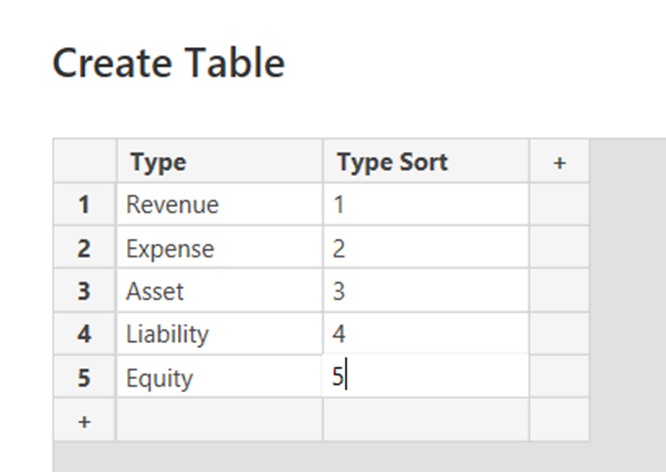
Create the Sort Table
- Select Enter Data from the Home ribbon.
- Create a new table called Account Type Sort.
- Add two columns:
- Type
- Type Sort
- Enter the account types and desired reporting order.
- Load the table into the data model.
Step 8: Creating the relationship of Account Type Sort data
To display your Profit & Loss report in a logical financial order, the Account Type Sort table must be connected to the transaction data model. This relationship enables Power BI to apply the custom sort order when displaying account categories in reports and visualisations.
Creating the Relationship
- Open Model View in Power BI.
- Select Manage Relationships and choose New Relationship.
- Connect the Account Type field in the Account Transactions table to the Type field in the Account Type Sort table.
- Configure the relationship as:
- Cardinality: Many-to-One (*:1)
- Cross-filter direction: Single
- Select OK to create the relationship.
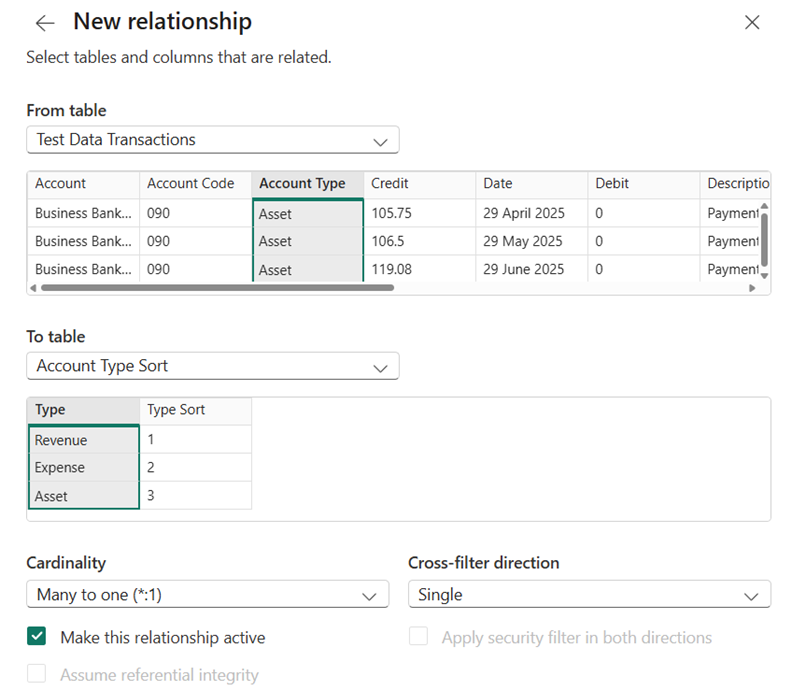
Ensure that the Account Type Column and Type Column is selected for you to create the relationship
Step 9: Building the P&L dashboard in Power BI:
With the data model complete, we can now create the Profit & Loss (P&L) report. We’ll use a Matrix visual to replicate a traditional Profit & Loss statement while retaining the ability to drill into individual accounts and periods.
Create the P&L Matrix
- Open Report View.
- Insert a Matrix visual from the Visualisations pane.
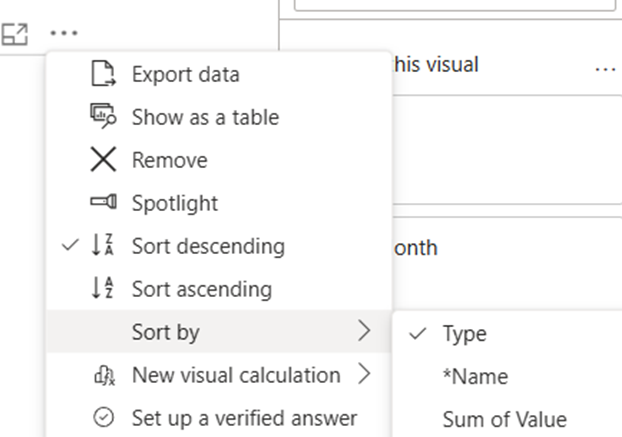
- Add the following fields:
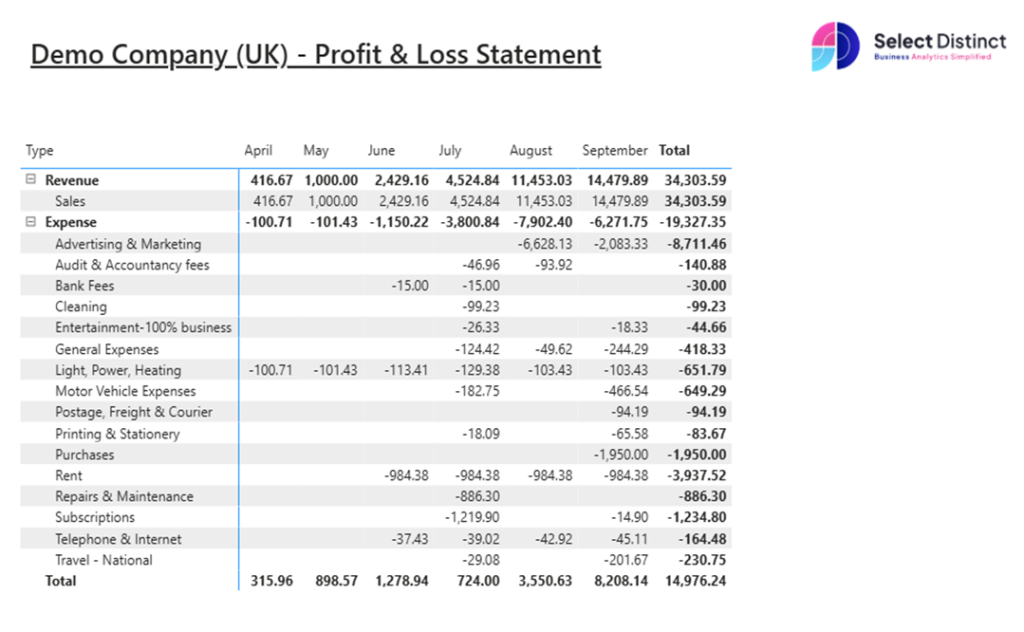
Finished Profit & Loss Report in Power BI
The completed report should display revenue and expenses by month, allowing you to analyse profitability and drill into individual account categories.
Validate the Results
Compare the balances in Power BI against the Profit & Loss report in Xero for the same reporting period. The figures should reconcile.
Enhancing Your Power BI Profit & Loss Report
Once your core P&L report is in place, consider adding:
- KPI cards for Revenue, Expenses and Net Profit
- Trend charts to analyse performance over time
- Slicers to filter by period or account category
- Company branding and colours
Final Thoughts
Building a Profit & Loss report in Power BI gives you greater flexibility than standard accounting reports, helping you analyse performance, identify trends and create management reporting that works for your business.
