Looker Studio Explained for Business Analytics
Looker Studio Overview
Looker Studio (now called Data Studio) is a free, cloud-based business intelligence and data visualization tool from Google. It is part of the Google Cloud Platform (GCP) ecosystem, although it remains accessible as a standalone tool for anyone with a Google account. It integrates seamlessly with GCP services, such as BigQuery, Google Analytics, and Google Ads, making it a natural choice for users already leveraging Google Cloud tools for data storage, processing, or analysis.
The platform allows users to connect to a wide variety of data sources, including Google Analytics, BigQuery, Google Ads, Google Sheets, SQL databases, and third-party platforms. The platform enables users to create interactive dashboards, reports, and visualizations that are fully customizable and easy to share with others.
Looker Studio Overview
Looker Studio allows users to connect to various data sources, including Google Analytics, BigQuery, Google Ads, Google Sheets, SQL databases, and third-party platforms. Users can create interactive dashboards, reports, and visualizations that are customizable and easy to share.
The platform is fully web-based, so no installation or local software is needed. You access it through a browser, where all data connections, reports, and visualizations are managed in the cloud.
Easy to Get Started
Start Free
Access Looker Data Studio
Access Via Google
Great for google search data
Where ever you are
Great introductory tool
What are the components and architecture of Looker Studio?
Looker Studio is a business intelligence suite that brings together various technologies. Looker Studio architecture consists of these components
Data Connections:
It supports both Google and non-Google data sources, allowing users to pull data from multiple platforms.
Interactive Dashboards:
Users can create dynamic dashboards with filters, drill-down options, and data interactions to explore and present data in real time.
Customisable Reports:
Offers flexibility in designing layouts, applying themes, and using various chart types (bar charts, pie charts, line graphs, tables, etc.).
Collaboration and Sharing:
Teams can collaborate on reports, and the reports can be shared or embedded in websites.
Automated Updates
Data is updated in real-time or on a scheduled basis, ensuring that reports reflect the most current data.
Ease of Use:
With its drag-and-drop interface, Looker Studio is user-friendly, making it accessible to both technical and non-technical users.
Overview of a typical Looker Studio Project
Project Setup
- Data Source Connection: The project begins by connecting to one or more data sources. This could include Google services like Google Analytics, Google Ads, or BigQuery, as well as third-party platforms.
- Data Preparation: Once connected, the data may need to be cleaned, transformed, or blended to create the desired dataset for analysis.
Report Creation
- Dashboard Design: The core of the project involves creating a dashboard. This includes:
- Designing the layout
- Adding charts, tables, and other visualizations
- Incorporating filters for interactivity2
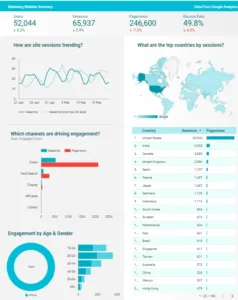
- Visualization Development: Various types of charts are typically used, such as donut charts, line charts, and bar charts, to represent different aspects of the data
- Dashboard Design: The core of the project involves creating a dashboard. This includes:
Looker vs Looker Studio
Looker is an enterprise-grade business intelligence (BI) and data analytics platform that Google acquired in 2019. It is also part of the Google Cloud Platform (GCP). Unlike Looker Studio, which is a free, user-friendly data visualization tool, Looker is designed for more complex data modelling and in-depth analytics. It targets enterprise users who need advanced capabilities to explore and analyse data across their organisation.
Looker is intended for advanced users who need powerful data modelling and enterprise-level BI capabilities.
Looker is primarily cloud-based, designed to work within the Google Cloud Platform (GCP) ecosystem butt offers more deployment flexibility than Looker Studio.
- Cloud-hosted: Most Looker deployments are hosted in the cloud, either through Looker’s managed services or via cloud infrastructure such as Google Cloud, AWS, or Azure.
- On-premises deployment: Looker can also be deployed on-premises, suitable for organizations that must keep their data in-house due to security, regulatory, or infrastructure requirements. This option provides more control over the environment but adds complexity in terms of setup and maintenance.
Looker Studio Cost
Looker Studio is a free tool.
The cost of Looker is not publicly listed with fixed pricing, as it varies depending on the specific needs and scale of the business. Pricing is generally customized based on several factors:
Number of users: Looker charges based on the number of users, and this includes different pricing tiers for different user roles (e.g., viewer, developer, or admin).
Data volume and infrastructure: The amount of data processed and the infrastructure required to support the analytics needs can impact pricing.
Deployment size and complexity: Whether Looker is used for a small team or deployed across an entire enterprise affects the cost.
Additional features: Advanced features, custom integrations, and higher levels of support or training may increase the cost.
Looker typically offers customized quotes based on these factors and suggests a discussion with their sales team to determine pricing specific to the organization’s use case.
Summary
Looker Studio is a cloud-based business intelligence and data visualization platform from Google, designed to help users transform complex data into interactive and visually appealing reports and dashboards. It allows seamless integration with over 800 data sources, including Google services like BigQuery and Google Analytics, as well as various third-party platforms.
Expert guidance, on hand to help you when you need that little bit of extra guidance
or you might want to refer to our Looker Studio Glossary
Frequently Asked Questions
-
What is the difference between Data Studio and Looker Studio?
In April 2026, Google officially rebranded Looker Studio back to Data Studio. This was a strategic move to distinguish the self-service dashboarding tool from "Looker," which remains Google's governed enterprise BI platform. If you have been using Looker Studio, your reports, data sources, and links remain exactly the same—only the name in the top corner has changed.
-
Is Data Studio still free?
Yes. The standard version of Data Studio is a free, cloud-based tool that allows for unlimited report creation and sharing. For organisations that need enterprise-level features—like Team Workspaces, organizational asset ownership, and enhanced administrative controls—Google offers Data Studio Pro
-
Can I blend data from different sources?
Absolutely. One of the most powerful features of Data Studio is Data Blending. You can join up to five different data sources (such as Google Ads, Meta Ads, and Shopify) into a single chart or table. This allows you to create a "Single Source of Truth" and view your cross-channel marketing performance in one unified dashboard.
-
How does Data Studio handle large datasets?
For small to medium datasets, Data Studio connects directly to sources like Google Sheets or GA4. However, for massive datasets, we recommend using Google BigQuery as a foundation. Connecting Data Studio to BigQuery ensures your reports load instantly and bypasses the "API Quotas" that can sometimes slow down or break direct connections.
-
What is "Conversational Analytics" in Data Studio?
Following the 2026 update, Data Studio now features built-in Gemini AI capabilities. This includes "Conversational Analytics," which allows users to ask natural language questions like "Which product had the highest conversion rate last week?" directly in the dashboard. The tool then automatically generates the chart or table to answer that question, making data exploration truly self-service.