Google Search Console is a very powerful tool to measure SEO performance.
This post highlights how with a little effort you can use Google Search Console Data in Power BI to create much more compelling dashboards
It tracks a vast amount of really insightful data, but the reporting is limited
The example below is the data for our website over the 12 months ending 29th February 2024
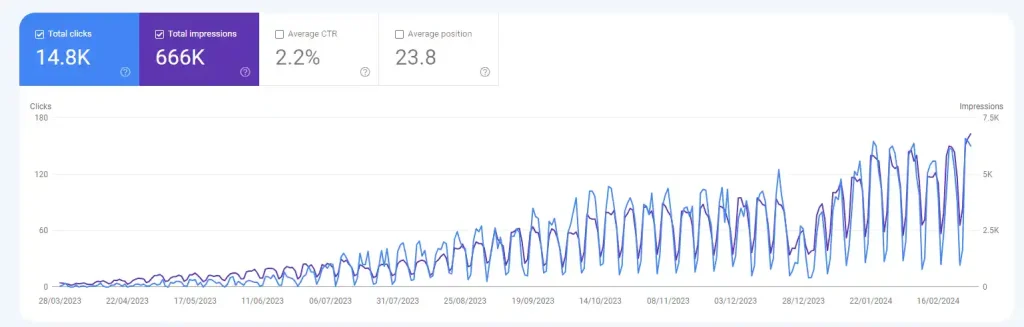
The most disappointing aspect to this is that the dates are fixed to individual dates, with no options for aggregation. This results in a very noisy report. Similar to many business to business organisations we see a drop off every weekend. It seems that weekends are not for business analytics
We want to show weekly summaries to track this data and smooth out a lot of this noise
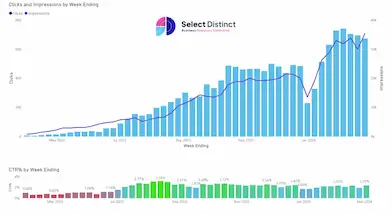
This looks a lot better and will attract more user engagement
Step by step guide to create the google search report in Power BI
Step 1 – Export the GSC data
At the top right of the google search console, click export
You can then save it as an excel file
In the Excel file there are a number of tabs
Queries
Pages
Countries
Devices
Search Appearances
Dates
and filters
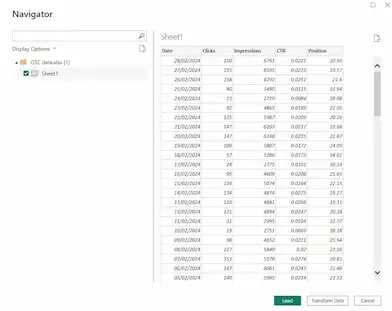
In this example we are only using the Dates page
We deleted all of the other sheets and saved the file as ‘GSC data’
Step 2 – Load the data into Power BI Desktop
Open Power BI Desktop
Click Get Data and select your excel file, wherever you saved it
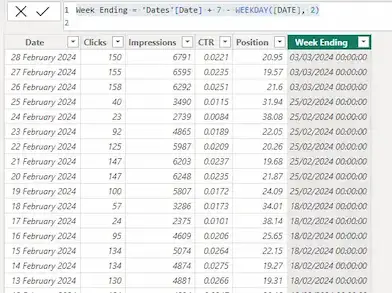
Step 3 – Add a week ending date column using DAX
Go to the table view, and click new column, then use the DAX code to create the new column
Week Ending = 'Dates'[Date] + 7 - WEEKDAY([DATE], 2)now press enter and your new Week ending column is added
The default format of this column needs to be changed to make it more presentable
We want to show it as 03 Mar 24
But none of the standard formats have this option
Step 4 – Apply a custom date format
Go to the model view, and select the field you want to set the format
In the properties panel scroll down to Date Time Format
In the drop down list there is a ‘custom’ option at the top of the list
You now see a custom format box, type this notation
dd mmm yy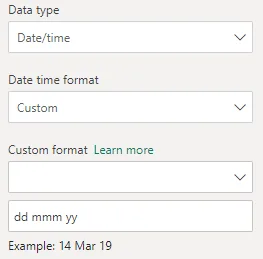
The example shows us a format we are looking for
Final Step – create the power bi report
We brought the Impressions and clicks into a combo line and column chart, and used the new week ending fields as the x axis
Then created a separate measure for the click through rate and presented that below with conditional formatting to highlight the changes in those rates using a gradient scale
We have embedded this into the page so you can expand it and explore it a little
Conclusion
Using the standard google search console report is ok for technical exploration. But if you want to share this information with a wider audience who want to see more compelling and attractive reports. You need to apply some reporting skill to the solution
Using Google Search Console Data in Power BI shows you how it can be done with a simple static data example, bringing custom date formats, conditional formatting and a calculated column into the mix to make it much more user friendly
Subscribe to our channel to see more tips and timesavers
Select Distinct YouTube Channel
Want help visualising your SEO data in Power BI?
Explore our How-To Guides for real-world fixes
Browse our Dashboard Design & BI Tools for layout tips
Contact Us to tailor your SEO dashboard