How to Conditional format a line chart in Power BI
(This is a workaround to show you how you can conditional format a line chart in Power BI)
Power BI does not at first seem to have an option to add conditional formatting to a line chart, but, there is a way to make it work, although it takes a few simple steps to do it
here is of the summary of the steps required
- Create a bar chart
- Apply conditional formatting to the bar chart
- Change the bar chart to a line chart and the conditional format remains
Because this a workaround it may mean that at some point Microsoft stops this working, but there will hopefully be an official method to ensure that we can still apply conditional formatting to a line chart
Step 1
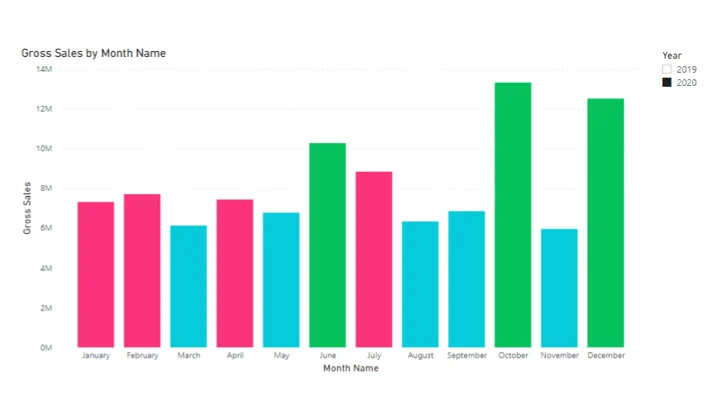
The first step is to create a normal bar chart, in this example we use a stacked column bar chart
Here we can see Gross Sales by Month across a year of data

Step 2
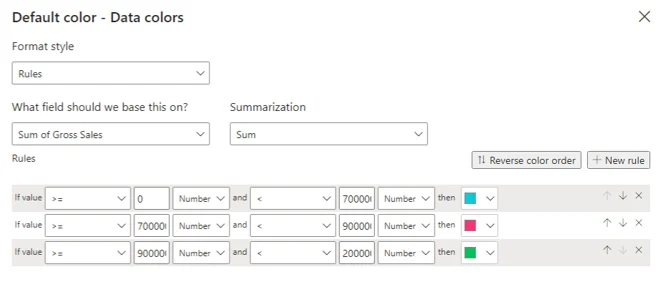
Next, we apply the normal conditional formatting rules
to do this in the formatting area, select the ‘fx’ icon next to the default colour option
we have defined fixed bands with blue representing low sales, red for medium and green for high
Step 3
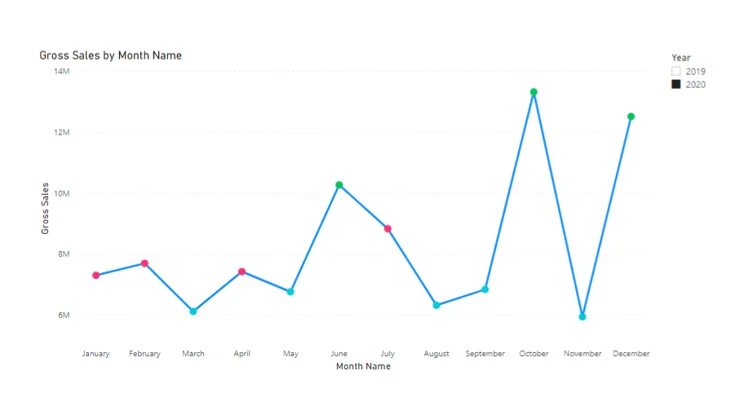
Finally we just need to change it to a line chart, and the conditional formatting we defined earlier is preserved
With the bar chart selected, go over to the visualisations pane and click the line chart icon, the chart is changed to a line chart and the conditional formatting is preserved
And there you have it, how to conditional format a line chart in Power BI
Here is a short video which explains these steps in a little more detail
Conclusion
Many users have asked us how to conditional format a line chart in Power BI, this work around shows how it can be done
Blog post by Simon Harrison
Simon Harrison

Subscribe to our channel to see more Power BI Timesavers
Select Distinct YouTube Channel
Our Business Analytics Timesavers are selected from our day to day analytics consultancy work. They are the everyday things we see that really help analysts, SQL developers, BI Developers and many more people.
Our blog has something for everyone, from tips for improving your SQL skills to posts about BI tools and techniques. We hope that you find these helpful!
You can find our other Power BI Blog posts in this archive