Power BI Licensing: The Ultimate Guide

Leverage tools like Power BI is crucial for businesses seeking to gain insights and make informed decisions. However, navigating the various licensing options can be a challenge. This guide aims to demystify Power BI licensing, helping you choose the right plan for your organization. Understanding Power BI License Options When it comes to Power BI, […]
DAX Calculate Function: Best Practices and Alternatives
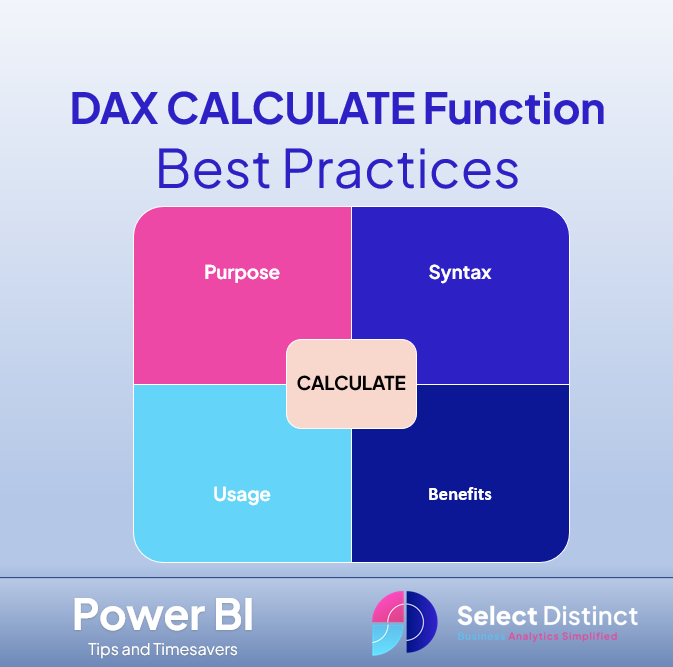
The DAX CALCULATE function is one of the most powerful tools within the Data Analysis Expressions (DAX) language. It is used in Power BI, SQL Server Analysis Services, and Excel PowerPivot. Understanding how to properly use CALCULATE is essential for creating dynamic and insightful reports. DAX (Data Analysis Expressions) is a formula language used in […]
Best Practices for Using Explicit Measures in Power BI
Part 2: Best Practices for Using Explicit Measures in Power BI (Part 2 of a 2 part post about modelling in Power BI) In our previous post we explained the differences between implicit and explicit measuresUnderstanding Implicit and Explicit Measures in Power BI This post builds on that and explains some best practices for using […]
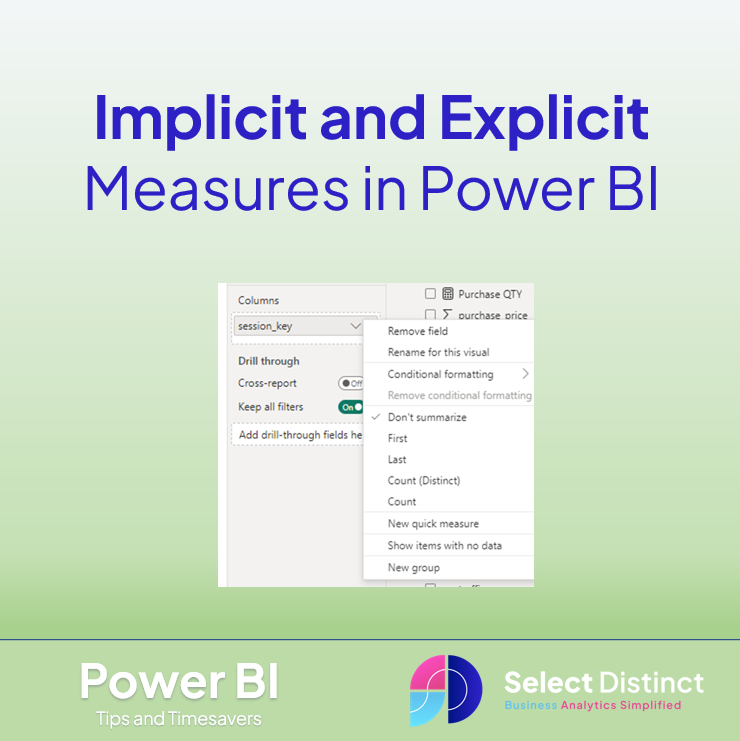
Implicit and Explicit Measures in Power BI
(Part 1 of a 2 part post about modelling in Power BI) In this post we will explain the key differences between implicit and explicit measures in Power BI We will also explain the “Discourage Implicit Measures” feature and its significance Understanding Implicit and Explicit Measures Implicit Measures What are Implicit measures in Power BI? […]
Power BI Many to Many Relationships

Power BI modelling is central to any report. Following best practise using a star schema, and many to one relationships are not always possible. One of the more complex features available is the many-to-many relationship. These can both beneficial and tricky to manage. In this post, we’ll break down how many to many relationships work […]
Understanding Power BI Gateways

One of the crucial components in this ecosystem is the Power BI Gateway. In this post, we’ll delve into what Power BI Gateways are, why they’re important, the associated costs, and the pros and cons of using them. What is a Power BI Gateway? A Power BI Gateway is a software application that acts as […]
Boost Your Power BI with Essential External Tools
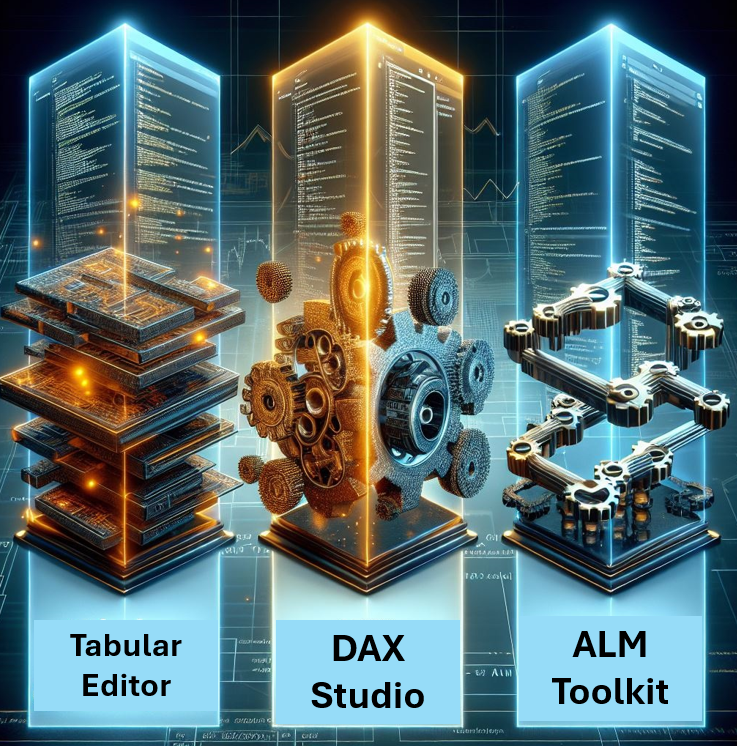
Power BI’s external tools work to enhance your development time. In this blog, we’ll look at some of the best external tools for Power BI and how they can enhance your data analysis and reporting. The tools are generally designed to review and optimise the performance of data models. These tools are great way to […]
Optimal Data Import Methods in Power BI

Power BI offers a range of data import methods. The traditional import methods of direct query and import are now the the latest import method of Direct lake. Each of these methods has its unique features, advantages, and best-use cases. In this blog, we will explore these methods in detail to help you choose the […]
DAX LOOKUPVALUE in Power BI
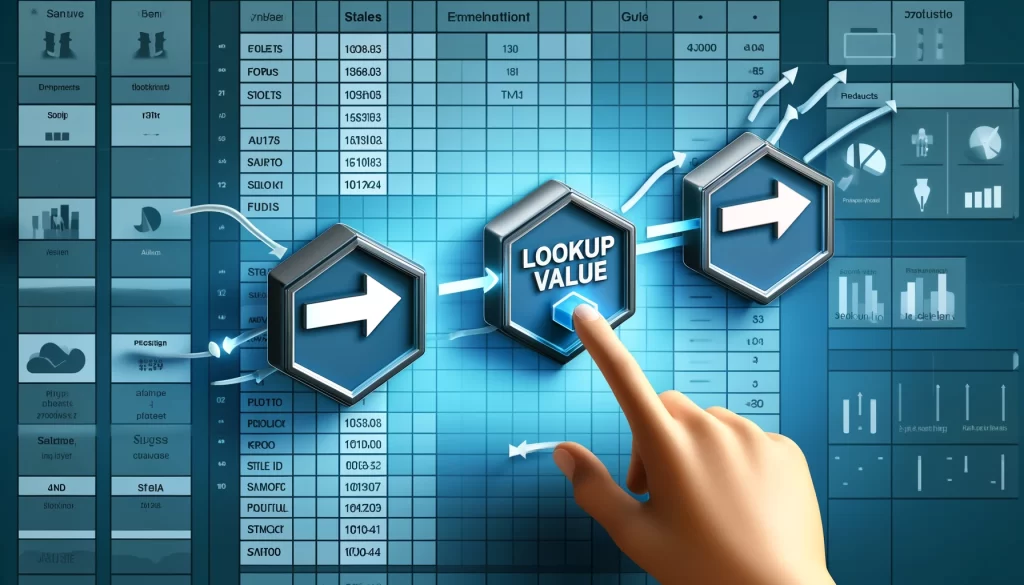
DAX LOOKUPVALUE function is the subject of this blog. It is particularly useful for retrieving values from tables based on specific conditions. In this blog, we will explore the LOOKUPVALUE function, its syntax and use cases. We will also cover examples to help you leverage its full potential. This is similar to the Power BI […]
Comparing Year on Year in Power BI
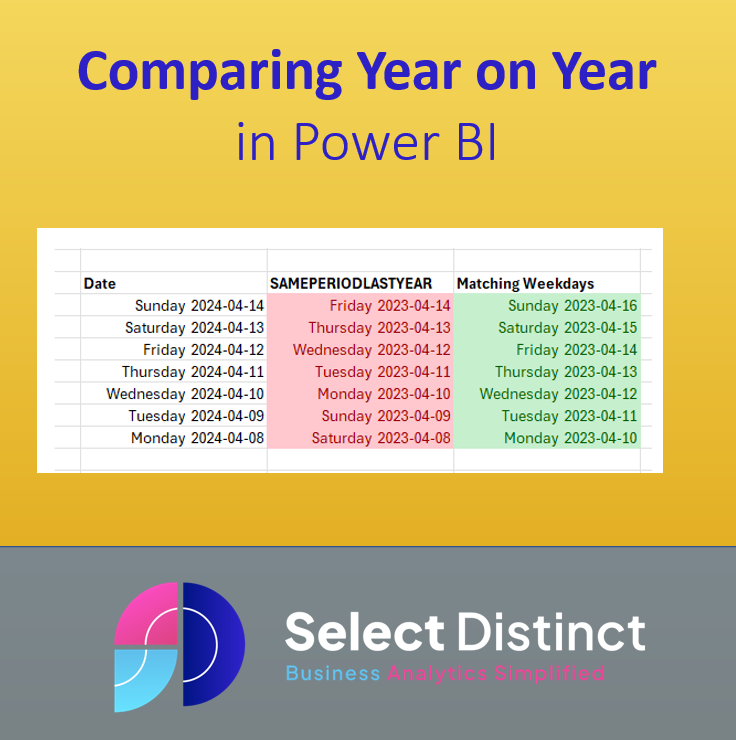
In an earlier post we showed you how to use SAMEPERIODLASTYEAR in power BI to compare data to the prior year The major shortfall of this is that the built in function matches the day of month and month, and does not properly reflect the day of the week If we show these with the […]