What is the TRANSPOSE function in Excel
The TRANSPOSE function in Excel enables users to easily switch between vertical and horizontal ranges of cells. It is used to rearrange data so that it can be more efficiently read and analysed. With its versatility, the function assists with quickly converting two-dimensional cell ranges without having to input data manually. For instance, if a dataset is arranged vertically but needs to be displayed horizontally, the TRANSPOSE feature will instantly do the job.
How to use Transpose function in Excel
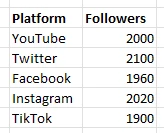
Here is an example of a data table which needs to be re-orientated
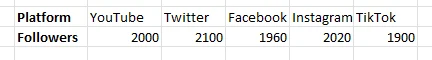
We want it to have all of the values across a row, like this
There are two different ways to do this
Using the Paste Special feature
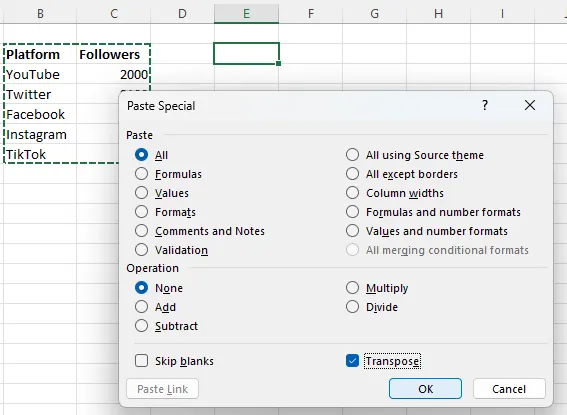
Highlight the data you wish to transpose (flip)
Once highlighted copy it and dashed lines should be around the copied cells
Then select the top left cell that you want your new table to start from, in the paste special box, select transpose near the bottom right and click OK
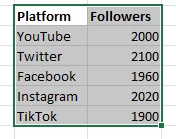
The data is copied and and flipped as you need it
This can also be done in reverse to flip from a landscape orientation to a portrait orientation
Using the TRANSPOSE function
In the Top Left cell of where you want your new table
Type =TRANSPOSE(
Then select the cells of the data you want to transpose
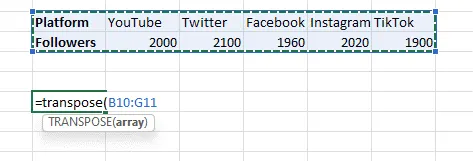
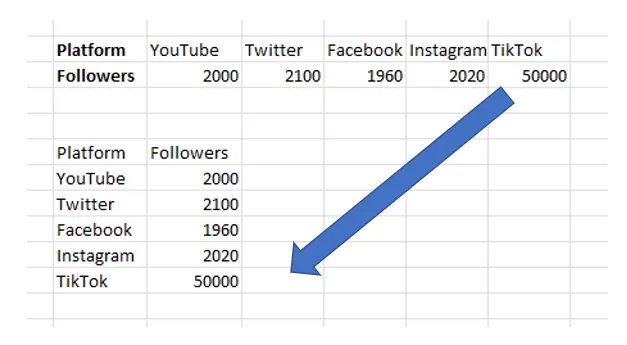
Press Enter and your new table appears, except this method create cells which are linked to the source
Because the values are in sync with this method a change in the top table is reflected in the bottom one
When to TRANSPOSE data
If you have a table of data that is arranged with each row representing a month and each column representing a different product, you can use the TRANSPOSE function to quickly change the orientation of the data so that each row represents a product and each column represents a month. This will enable you to create an effective chart that shows sales figures for various products over time.
Conclusion
Having the facility to flip a data table quickly and easily for different use cases can be a real time saver
Watch our video
Subscribe to our channel to see more tips and timesavers
Select Distinct YouTube Channel
Or find other useful SQL, Power BI or other business analytics timesavers in our Blog
Our Business Analytics Timesavers are selected from our day to day analytics consultancy work. They are the everyday things we see that really help analysts, SQL developers, BI Developers and many more people.
Our blog has something for everyone, from tips for improving your SQL skills to posts about BI tools and techniques. We hope that you find these helpful!