A Quick Guide to Connecting Power BI to BigQuery
Power BI is a leading business intelligence platform, with powerful features for self service analysis
BigQuery is a fully managed cloud based data warehouse platform for you to manage your data
The great thing about both of these platforms is that they both have a really useful free tier, enabling you to use some of the excellent public datasets to build your skills
This blog focuses on the use of power BI with one of those really useful datasets and assumes that you already have access to the google cloud platform, BigQuery and the Public datasets
Google Public Datasets are a great resource for learning
Google has made a variety of public datasets available, You can access these and query them and use them to develop your skills
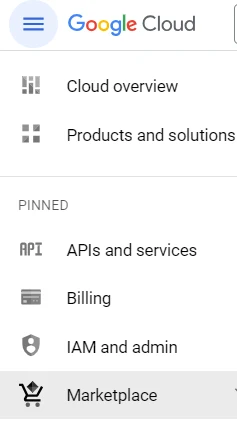
The marketplace in Google Cloud Platform is where you need to head to find the public datasets
From the top menu on the Google Cloud Platform, hit the ‘Hamburger’ icon and click on the Marketplace option
From here you need to select the Analytics category, and then under type, select Data sets
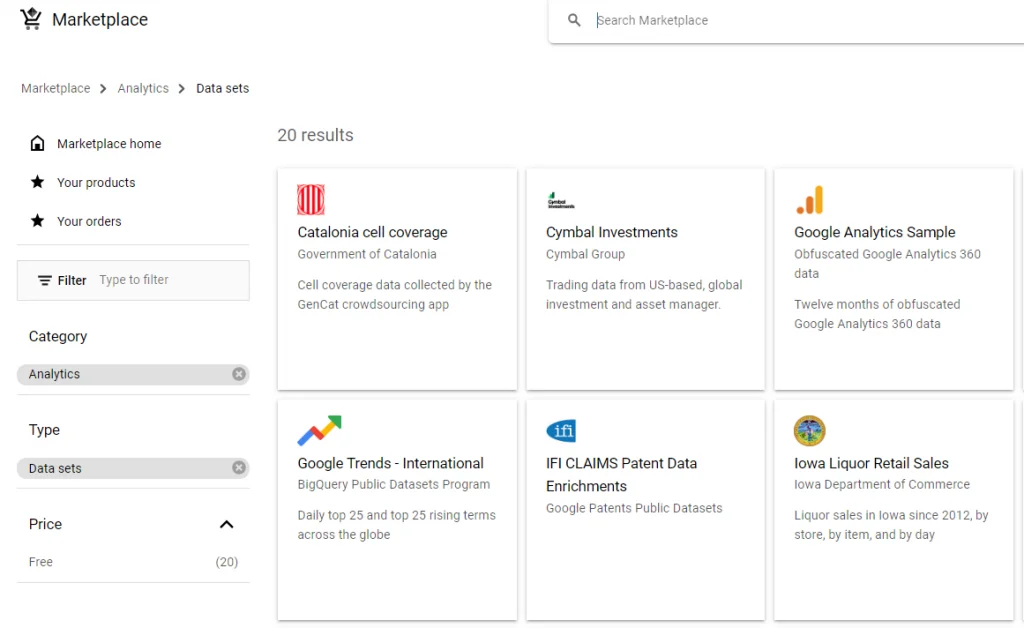
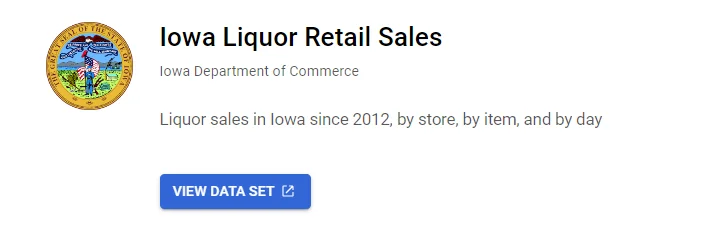
We will be working with the ‘Iowa Liquor Retail Sales’ data set
Overview of the Iowa Liquor Retail Sales public data set
Retailers in Iowa buy liquor from the State of Iowa, which controls the wholesale distribution of liquor for retail sale. This dataset has all the wholesale liquor purchases by retailers in Iowa since January 1, 2012. The dataset shows every wholesale order of liquor by any store that sells liquor, such as grocery stores, liquor stores, convenience stores, etc. The dataset has information about the store and its location, the brand and size of the liquor, and how many bottles were ordered.
This dataset is useful for analysing liquor sales in Iowa, as it covers all the retail liquor sales in the state. It is also a large and clean public dataset of retail sales data that can be used for other purposes, such as predicting when a store will run out of stock, forecasting the demand for liquor, and solving other retail supply chain problems.
The great thing about this data set is that is real data, updated monthly and it has plenty of variation for you to try different techniques on
To find out more about the data follow this link
Iowa Liquor Sales | data.iowa.gov
Click the view data set button
You are then taken to your Google BigQuery platform, straight to the data set
You can also now see lots of other public data sets
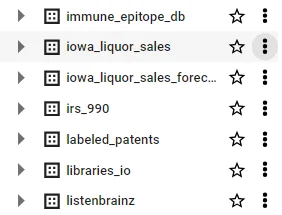
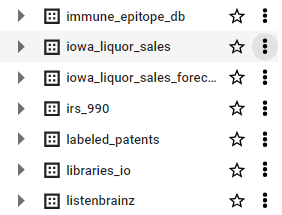
Effectively this is a database with a single table called ‘Sales’
Expand the chevron and you will see the table
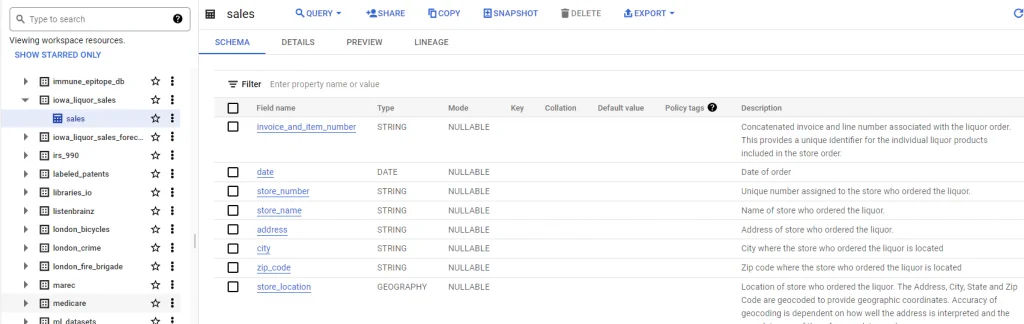
Within BigQuery you can carry out an exploration of the data and become familiar with the data types it contains
How to Connect Power BI to Google Big Query
We will connect our Power BI Desktop to this and start visualising the data
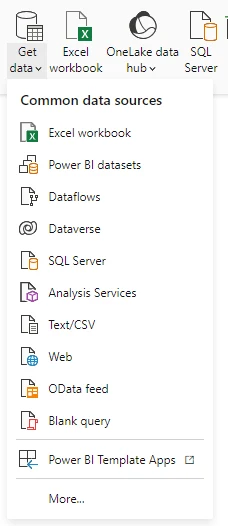
Step 1. Click on Get data on the ribbon, then click more… at the bottom of the menu
Step 2. Select Database, then scroll down to Google BigQuery
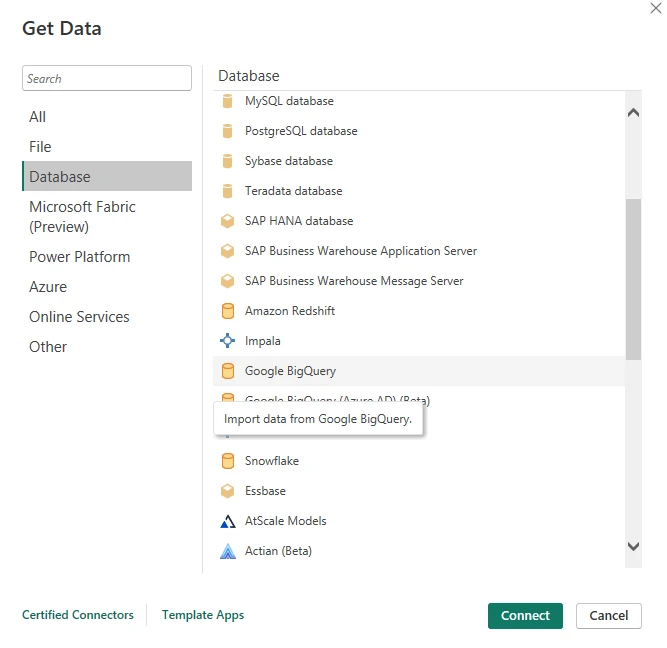
Step 3. Connect Power BI to Google BigQuery by clicking the connect button
If you are already logged in then thats all there is to do
If you are not already logged in then you may be taken to a login screen for authentication
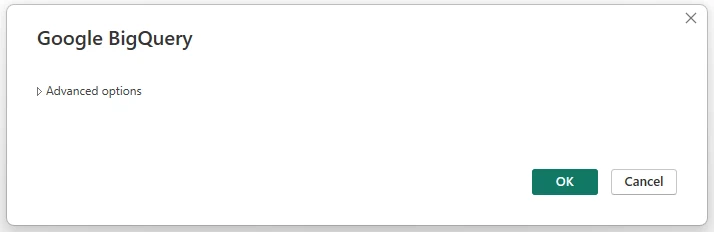
From here you can go into the advanced option and explicitly write the SQL to retrieve the data you need
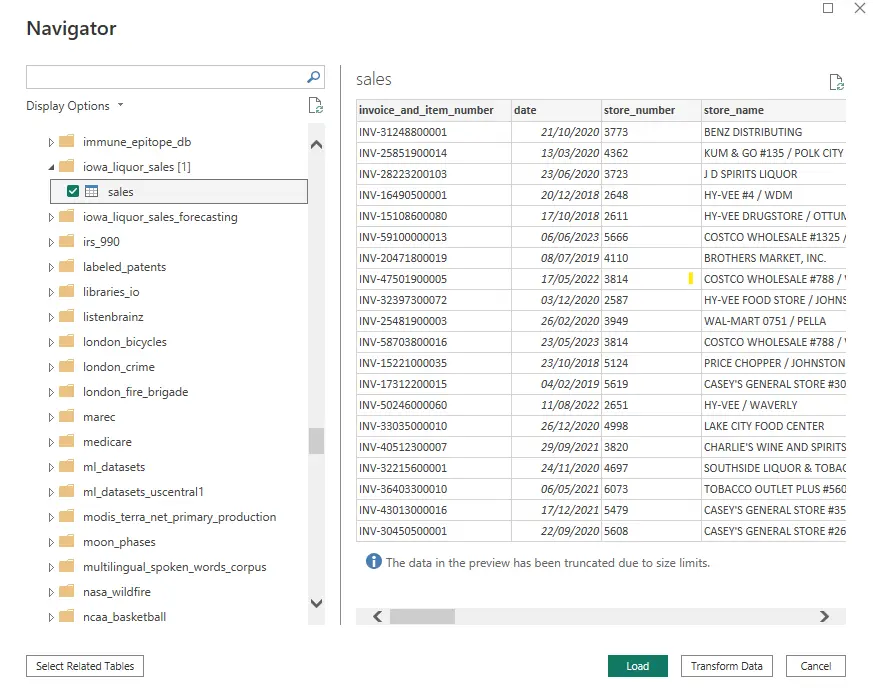
Or, if you click OK you are presented with a navigator screen
Scroll down to find the Iowa Liquor sales database, then select the sales table. Ensure there is a green tick next to the table
If the data set was small then you could simply click load….BUT This data set contains over 27 million rows so we will need to strip it back
We will just load the last 12 months as an example
Click Transform Data then Import
On the date column, select the drop down arrow
Then date filters, In the previous
Now make sure the filter is set as below to retain the newest 2 years of data
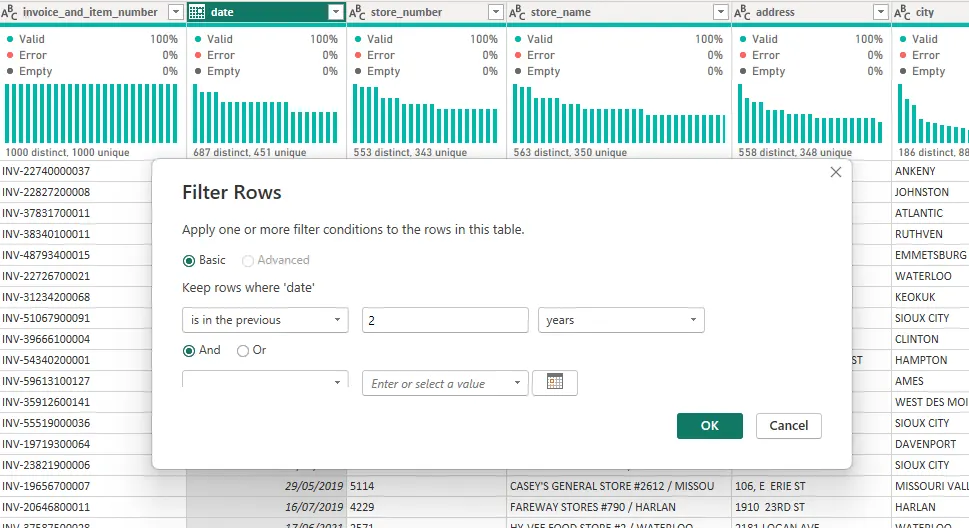
(You may want to filter down further to shrink the data set and avoid costs, so feel free to add more filters before loading the data to Power BI)
For this example, we want a large data set so we will use the full 2 years
Now select Close and Apply from the ribbon
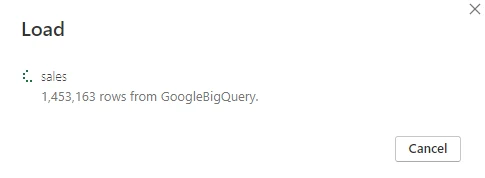
You will then see a loading screen with a count of how many rows have been loaded
Typically there is around 2.5m rows per year
After the data has loaded you can then begin to visualise the data
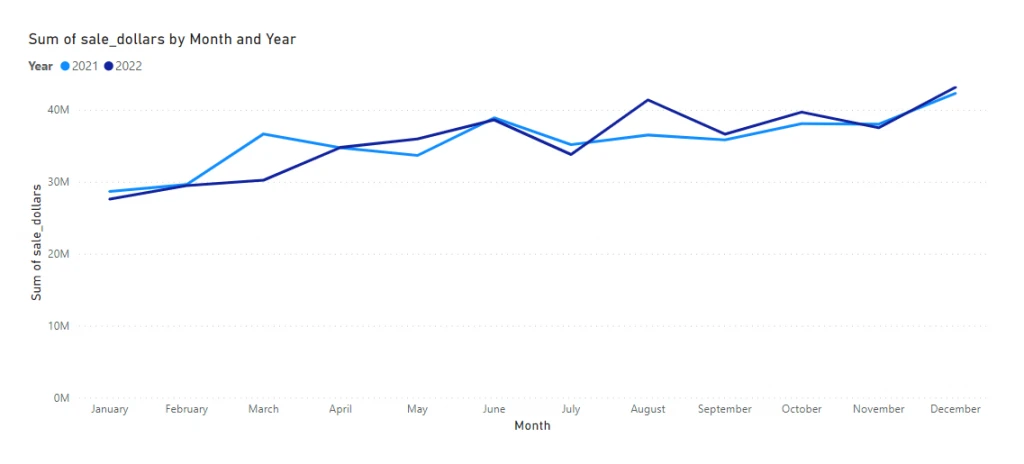
We will look at sales over the two years
Select a line chart visual and set the X axis to date (month)
set the Y axis to sale-dollars
finally set the year as the legend to compare the last two years on the same chart
Connect Power BI to Google BigQuery : Conclusion
As you have seen its actually quite easy to connect Power BI to BigQuery and use these public data sets for your own learning and development
By exploring the data you can begin to see real patterns in seasonality, identify best sellers, leading stores and use some of the more complex geo location data to present the data in easy to understand ways
Just be careful not to bring too much data back or too often or you could go over the free tier for BigQuery
Subscribe to our channel to see more tips and timesavers
Select Distinct YouTube Channel
Or find other useful SQL, Power BI or other business analytics timesavers in our Blog
Our Business Analytics Timesavers are selected from our day to day analytics consultancy work. They are the everyday things we see that really help analysts, SQL developers, BI Developers and many more people.
Our blog has something for everyone, from tips for improving your SQL skills to posts about BI tools and techniques. We hope that you find these helpful!