Introduction to Calculated Columns and Measures in Power BI
A guide to understanding the differences between calculated columns and measures in DAX for Power BI
What is a calculated column?
A calculated column is a static value added to a table, calculated row by row when you load the data.
What is a measure?
A measure is a dynamic value that changes based on what you’re looking at in a report, calculated dynamically within the filter context of a visual
If we use the example of calculating Gross Profit margins from a simple sales example.
We can use a calculated column to return a Gross Profit value.
Do this by subtracting the cost price from the sell price at a row level.
We could also do this to show the gross margin percentage of a transaction.
But, when we aggregate the data we need to calculate the gross profit margin percentage on the totals and sub totals of the data. We need to do this to get a true weighted calculation.
This article explains the difference between these items, you can follow along with the example by downloading this data
Excel Sample Sales Data
To follow along with the examples
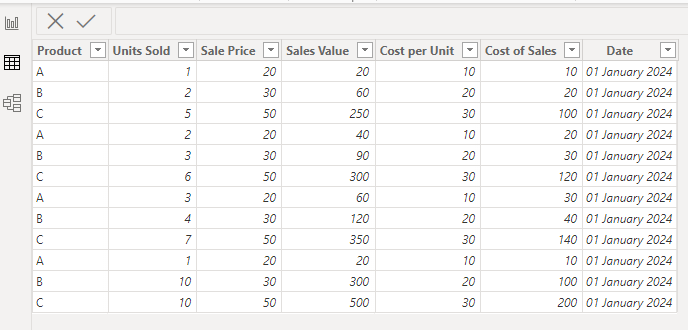
You can download the spreadsheet above and import it into Power BI Desktop
It will look like this
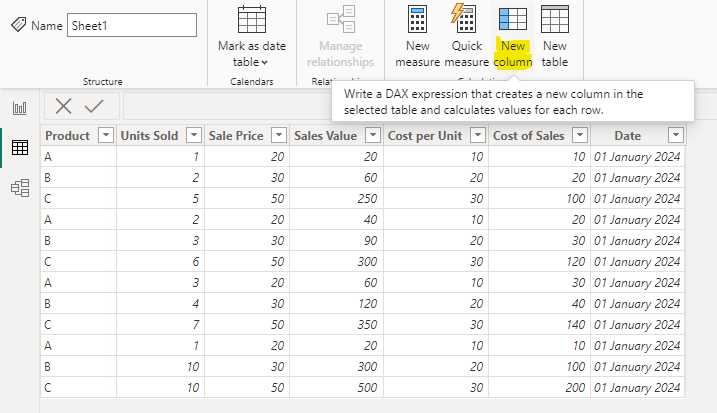
How to create a calculated column in Power BI
The first thing we will do is to calculate the Gross Profit for each row in this table
In the table view, select New Column from the Ribbon
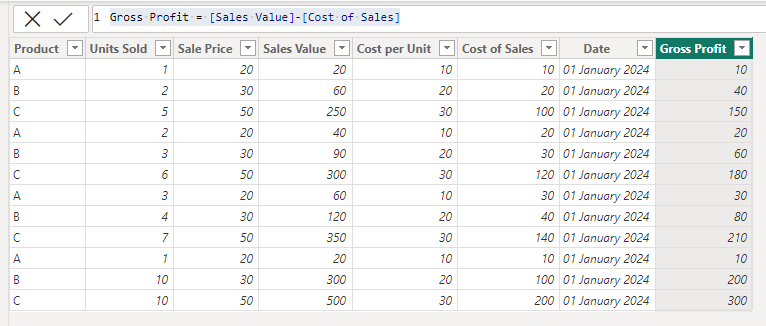
In the formula bar we type
This adds a new column, which calculates the gross profit by subtracting the cost of sales from the sales value
When we press enter the column is added to the table, and it is calculated for each row of data in that table
When the underlying data is refreshed and any new rows of data are added, this column is calculated after the data is loaded for every row
We can also add a calculated column for the gross profit margin
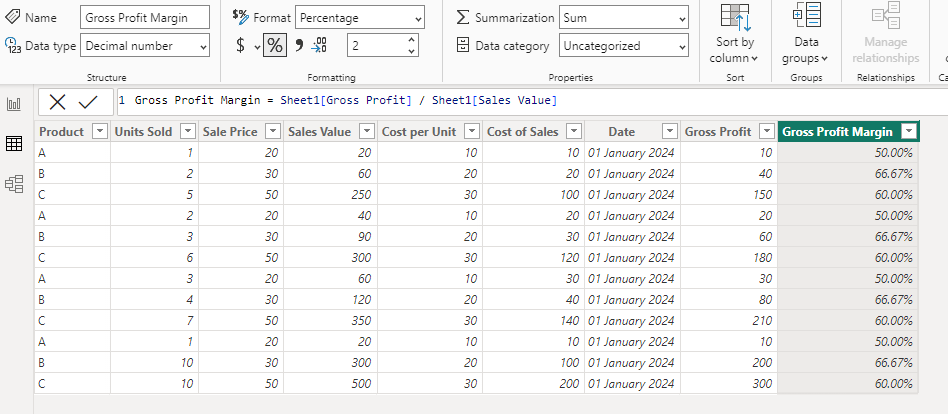
We also set the Format to be percentage and the number of decimal places to 2 decimal places
Benefits of Calculated Columns in Power BI
It is calculated once the data refreshes and is not affected by any other filters, effectively it is a static column. This means that it can be used as a filter. In our example we could use a slicer to only show products that have a margin lower than 60%
Limitations of Calculated Columns in Power BI
Potentially the biggest draw back of calculated columns is that they must be calculated in full before the data table can be used. This is usually not a problem if the data tables are small, but if you import a very large data table, then have complex calculations running down a number of columns you will see a performance impact. In that case it is often better to perform the calculation further back in the data transformation
See this article for some examples
Another limitation is that the calculation cannot be affected by what happens on the face of the report itself, so if a report wanted to see the overall margin percentage this cannot be done using a calculated column, but must be done using a measure
How to create a measure in Power BI
We want to create a measure that can calculate the overall gross profit margin, even if the report is filtered
To create the measure, go to the Table View, and click New Measure on the ribbon
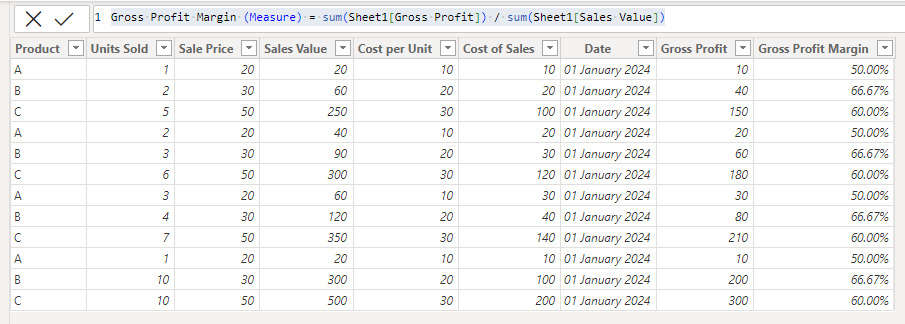
Then copy and paste this DAX code
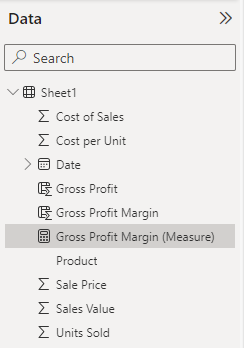
When you press enter, the measure is created. But unlike the calculated column, it does not appear in the table view
But, it does show as a measure on the data panel
We also set this to percentage format and to 2 decimal places
Benefits of Measures in Power BI
Measures are only calculated where used and are only calculated in the context of the face value of the report, this way they respond to filters and slicers
Limitations of Measures in Power BI
Measures can be more difficult to debug as they are more difficult to understand than a calculated column. But it can be made simpler to understand by creating separate measures for elements of a complex calculation. For example in this example we could create a measure for the sum of gross profit (the numerator) and check that. And we could also create a measure for the sum of the Sales (the denominator) and check that. Out gross profit measure could then just be the Numerator divided by the Denominator allowing us to debug the components separately
Using calculated columns and measures in reports
On the report view, drag a table to the canvas
Then add product, Sales Value, Cost of Sales and the calculated column for Gross Profit to the table
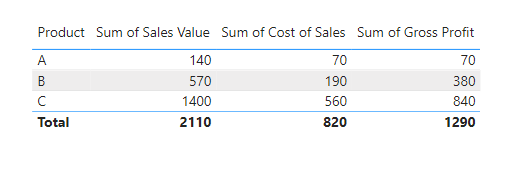
The default behaviour for summarisation is to sum the values, which is what we want
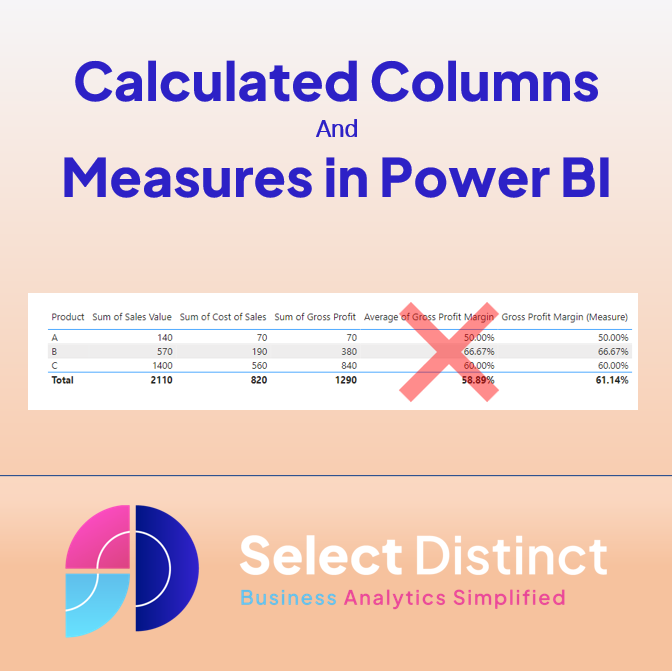
But, if we add the Gross profit percentage that we created as a calculated column to the table we get a problem, the default summarisation options cannot calculate the true gross profit
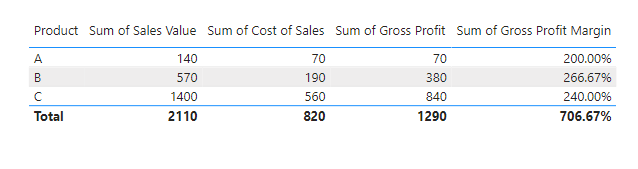
Do not use average to summarise gross profit percentages
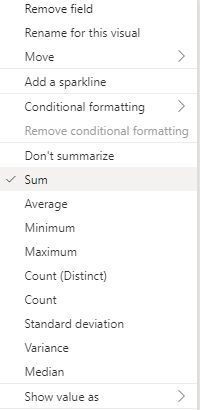
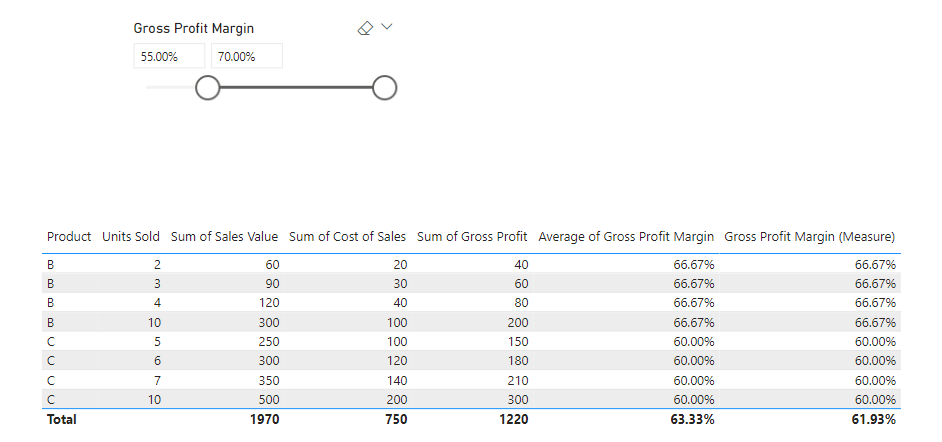
We frequently see this solution applied, which uses the simple average of the values
Although this initially looks correct, especially at the product row level, but the grand total is not correct
The correct answer should be 1290 divided by 2110, which equals 61.14%
Use the measure to show the gross profit margin
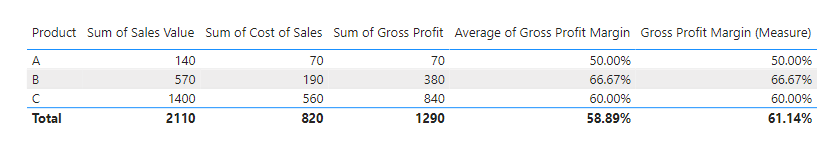
The measure correctly calculates the Gross Profit percentage on the overall values and all rows in the report
Use the Calculated Column values if you need to filter
if we add the quantity to the table for extra clarity and set it to not summarise we can see 9 rows of data
We can then use the calculated column values to filter the data for rows with a lower margin, Please note you cannot use a measure value in a slicer because you need to see the individual rows
Conclusion
This article explains the key differences between calculated columns and Toggle Measures in Power BI, with examples of why you will need to use both and some of the common errors that we see
The key thing to remember is to keep it simple by having the numerator and denominator for your measure in the data, even if it is a calculated column. Then when you need to roll up for something such as gross margin you can create simple measures such as sum(gross profit) divided by sum(net sales)
Ready to master calculated logic?
Explore more in Dashboard Design & BI Tools and Data Analytics & Business Intelligence
Learn key terms such as Calculated Columns in our Power BI Glossary
For broader strategy, visit our Business Analytics Blog and explore how model design drives insight.