Introduction
Business analytics involves utilizing data, methodologies, and tools to derive insights that assist organizations in reaching their objectives. It is crucial for organizations as it enables them to:
– Comprehend their present performance and pinpoint areas for enhancement.
– Forecast upcoming results and trends to make informed preparations.
– Streamline their operations and resources to minimize expenses and hazards.
– Innovate by developing new offerings and services to secure a market edge.
– Engage and work collaboratively with stakeholders and clients effectively.
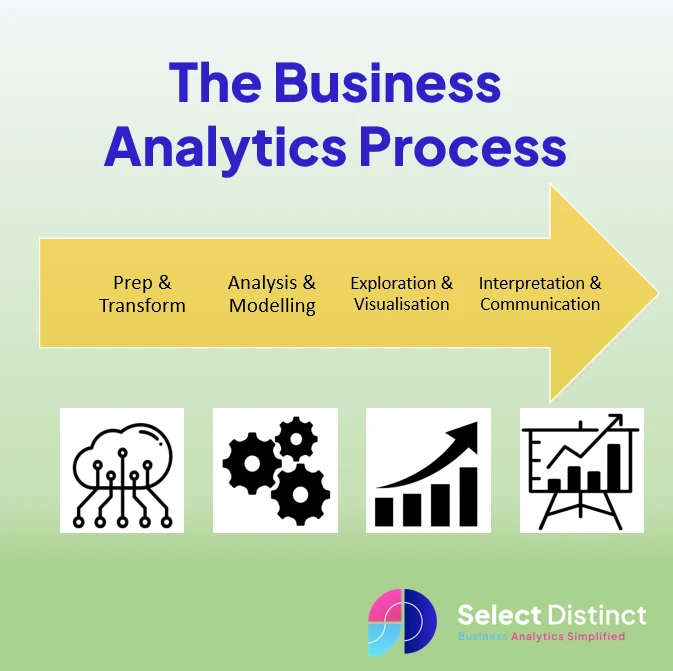
The main steps of the business analytics process are:
- Data preparation and transformation: To prepare and transform data, you need to collect, clean, integrate, and format it from different sources. This makes the data ready for analysis. The expected outcome is a consistent and reliable data set that can be used for further exploration and modelling.
- Data analysis and modelling: Applying statistical and machine learning methods to data to discover patterns, trends, and relationships. These can provide insights and support decision making. The expected outcome is a data model that can describe, predict, or prescribe actions based on data.
- Data exploration and visualization: Using graphical and interactive tools to explore and present data in a meaningful and engaging way. Data visualization that can reveal insights, highlight findings, and communicate stories from data.
- Data interpretation and communication: we use storytelling techniques to explain data analysis results and recommendations. The expected outcome is a data presentation that can inform, persuade, and inspire the audience and stakeholders.
Data preparation and transformation

The sources and types of data that can are used for business analytics include:
- Internal data: The organization generates and stores internal data, such as sales records, customer feedback, inventory, financial reports. Internal data is typically structured and easy to access and analyse.
- External data: This refers to the information obtained from outside the organization, like market trends and competitor information. It can offer valuable insights and opportunities, but it can also be unstructured and hard to integrate and process.
- Quantitative data: This is the data that is numerical and can be measured and analysed using mathematical and statistical methods. Quantitative data gives objective and reliable info about the organization’s performance and outcomes. It includes revenue, profit, market share, and customer satisfaction.
- Qualitative data: This is the data that is textual or visual and can capture the opinions, preferences, emotions, and experiences of the organization’s stakeholders, such as customers, employees, partners, etc. Qualitative data can provide rich and nuanced insights and understanding of the needs and expectations of the organization, but it can also be subjective and difficult to quantify and compare.
Data analysis and modelling

Data analysis is the process of using data, methods, and tools to generate insights and solutions that can help organizations achieve their goals. There are different methods and approaches of data analysis, such as descriptive, predictive, and prescriptive analytics, that can provide different types of information and guidance for decision making. Here is a brief overview of each method and approach:
Descriptive analytics
Descriptive analytics examines what happened in the past. It uses historical data to identify patterns and trends and present them in a way that is easily understood. Descriptive analytics is the most common and basic form of data analysis, as it answers questions like how much, how often, or what happened. Descriptive analytics can use simple mathematical and statistical tools, such as arithmetic, averages, and percentages, as well as visual tools, such as charts and graphs, to summarize and display data.
Examples include Year on Year sales analysis, Profitability Analysis or Analysis of customer survey responses
Predictive analytics
Predictive analytics predicts what could happen in the future. It uses historical and current data to create models and forecasts that estimate the likelihood of future outcomes and scenarios. Predictive analytics is a more complex and advanced form of data analysis, as it uses probabilities and uncertainties to make informed guesses and projections. Predictive analytics can use sophisticated mathematical and statistical tools, such as regression, classification, and machine learning, as well as simulation and
optimization techniques, to build and test data models.
Examples of predictive analytics includes forecasting demand for a product or credit risk scoring
Find out about our Predictive Analytics Consulting Services
Prescriptive analytics
Prescriptive analytics prescribes what should happen in the future. It uses historical, current, and future data to generate recommendations and suggestions that can optimize the performance and outcomes of the organization. Prescriptive analytics is the most complex and advanced form of data analysis, as it uses optimization and decision analysis to make the best possible choices and actions. Prescriptive analytics can use complex mathematical and computational tools, such as linear programming, integer programming, and genetic algorithms, as well as artificial intelligence and expert systems, to solve and evaluate data problems.
Examples include route planning and pricing optimisation
Each method and approach of data analysis has its own advantages and disadvantages, and they can be used separately or together to support the organization’s goals and objectives. By understanding the differences and similarities between descriptive, predictive, and prescriptive analytics, you can choose the ones that will benefit your business most and ultimately drive better decisions.
Data exploration and visualization

Exploring and visualizing data is crucial for analysing it, understanding it, and finding insights. Here are some of the benefits and principles of data exploration and visualization:
- Exploring and visualizing data can help you clean and prepare it for analysis. This involves identifying and resolving issues like missing values, outliers, errors, or inconsistencies.
- Exploring and visualizing data helps you describe and summarize it. You can see how the data is distributed, its centre, spread, and relationships.
- Using data exploration and visualization, can generate and verify ideas, assumptions, and questions.
- You can analyse and see data, then use statistics and machine learning to make predictions. Displaying the results is also important.
- You can use data exploration and visualization to share and convince others about data. This includes presenting and explaining data findings and suggestions to various people.
Principles of data exploration and visualization:
- To be purposeful and focused, by having a clear and specific goal and question for each data analysis task.
- To be accurate and truthful, by representing data and avoiding distortion, manipulation, or deception.
- To be appropriate and effective, by choosing the right type and format of data display that suits the data and the message.
- To be attractive and engaging, by using colours, shapes, and styles that enhance the aesthetics and readability of data displays.
- To be interactive and dynamic, by allowing users to explore, manipulate, and customize data displays according to their needs and preferences.
Data interpretation and communication

Data interpretation and communication are essential skills for data analysts, as they enable them to turn data into insights and actions. However, data interpretation and communication also pose several challenges, such as:
- Data complexity and ambiguity: Data can be complex and ambiguous, especially when it comes from many sources, has different formats and structures, or contains errors and outliers. To handle complex and unclear data, data analysts must use methods to clean, transform, and analyse data. They should also use clear definitions and assumptions.
- Data bias and ethics are important considerations. Data can be biased and unethical for various reasons. One reason is when it reflects human prejudices, preferences, or values. Data analysts need to be aware of data bias and ethics by applying principles and standards to ensure data quality, security, and privacy, and by respecting the rights and interests of data subjects and stakeholders.
- Visualizing and telling stories with data can be challenging, especially with big or complex data. Data analysts must learn data visualization and storytelling. They select the best ways to display data and use colours, shapes, and styles to make it easier to read. They also use storytelling techniques to share data messages and recommendations.
Conclusion
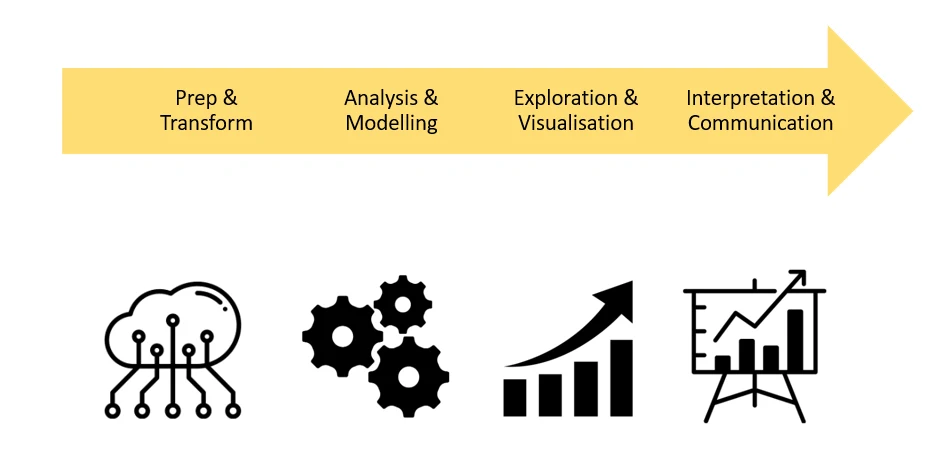
The core business analytics process involves the 4 main stages of
- Preparation and Transformation
- Analysis and Modelling
- Exploration and Visualisation
- Interpretation and CommunicationUnderstanding each of these stages is a key part of the business analytics process.Also understanding how and where the different skills and disciplines are required to ensure that insights can be trusted and actionable