What is Forward Stock Cover?
Forward stock cover is a technique used by retailers to determine how long the current stock will last considering forecasted sales quantities
It is used to control the levels of stock to help ensure that the stock is held at a appropriate level with the risk of being short of stock or left with an over stock position at the end of the product life cycle
Forward Stock Cover Example
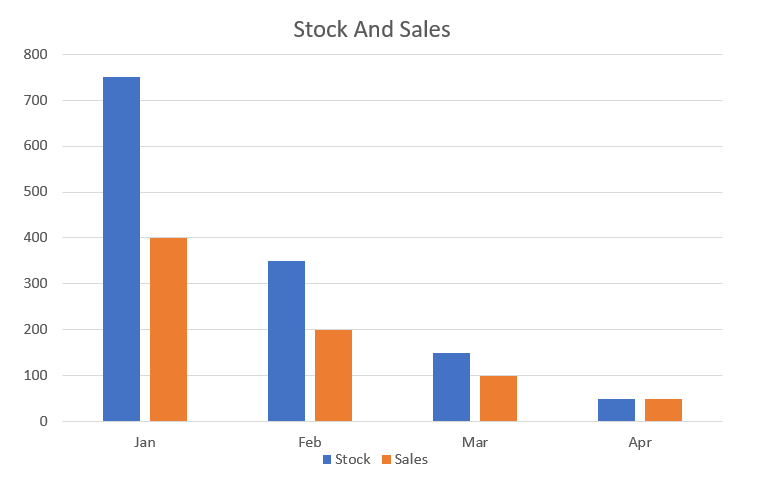
The inventory forward cover calculation is failry straight forward, in this example we will use a series of future monthly sales forecasts to set a target stock holding
Using the example in the above chart we can see the following sales by month
January 400
February 200
March 100
April 50
So, in total at the beginning of January if we want the product to last 4 months forwards. We need to take the forward looking total of 400+200+100+50 = 750 units to be the target stock holding
Step by Step Guide to Calculating Forward Stock Cover using Google BigQuery
We will show you step by step how to use Google Big Query to calculate Forward Stock Cover
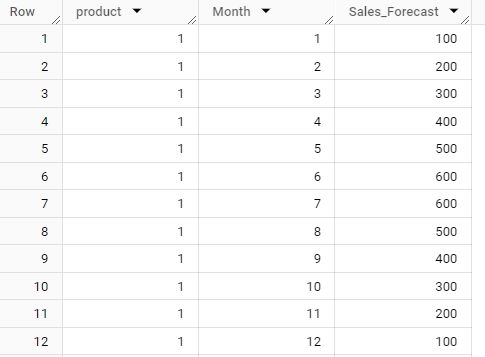
Firstly, we will start from a trusted Sales Forecast by product
select *
 from `Sales_Forecast`s
 order by product, Month, Sales_Forecast
This give us this output
(You can copy sample code from our blog page if you want to follow along)
Step 2 – Defining the Stock Holding Targets
Keeping our example simple, we have three products
Product 1 is our most important product, we never want to risk being out of stock. For this we set the target to 4 months forwards
Product 2 is less important, so we will target three months
Product 3 is a not so important product, we want to actually run out as the risk of not being able to sell it is too great
Keeping our example simple, we have three products
Product 1 is our most important product,
we never want to risk being out of stock. For this we set the target to 4 months forwards
Product 2 is less important, so we will target three months. Our customers expect us to be well stocked in the peak but not carry too much out of season
Product 3 is a not so important product, we only want to carry stock in the peak periods as the risk of not being able to sell it is too great
select s.*
, case
when product = 1 then 4
when product = 2 then 3
when product = 3 then 2
end as Stock_Target_Months
from `Sales_Forecast`s
order by product, Month, Sales_Forecast
Using a SQL Window Function to calculate sub totals
We use a SQL Window function to calculate the forward stock cover, but instead of jumping straight into the end result we will show you the steps
The window function is made up of two parts initially
sum(Sales_Forecast), this is the calculation to be performed
over (partition by product), this is the ‘window’
In this case we want the column to return the same sub total for all sales forecasts for each product
select a.*
, sum(Sales_Forecast) over (partition by product) as Total_Product_Sales_Forecast
from
(
    select s.*
    , case
    when product = 1 then 4
    when product = 2 then 3
    when product = 3 then 2
    end as Stock_Target_Months
    from `Sales_Forecast`s
    order by product, Month, Sales_Forecast
) a
We can see that each row shows the overall total of the sales forecast for that product.
This is useful, and saves us having to use a group by to return sub totals for each product
But…..we want to show the requirements on a forward looking basis so we need to add a little more complexity
Using a SQL Window Function to calculate running totals
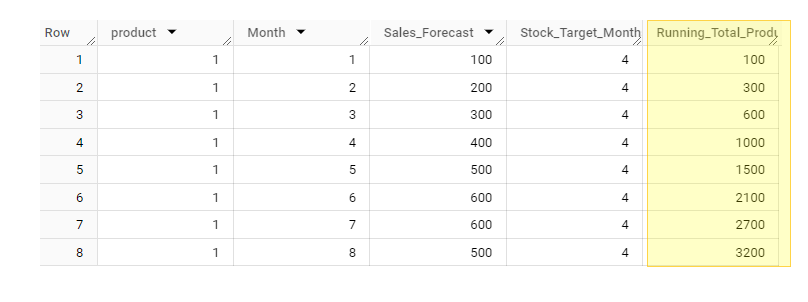
We now add an order by clause into the partition
This changes the sub total into a running total
select a.*
, sum(Sales_Forecast) over (partition by product order by month) as Running_Total_Product_Sales_Forecast
from
(
    select s.*
    , case
    when product = 1 then 4
    when product = 2 then 3
    when product = 3 then 2
    end as Stock_Target_Months
    from `Sales_Forecast`s
) a
 order by product, Month
We can see the output shows the totals increasing with each month
Using a SQL Window Function to calculate running totals
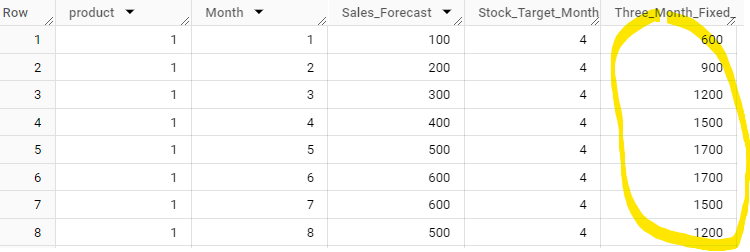
The next thing we can do is to enhance the window function by telling it how many rows we want to use for a forward looking forecast
To do this we add ROWS BETWEEN CURRENT ROW AND 2 FOLLOWING
This instructs the window to use the current row and the next two months give a fixed three month forward requirement figure
select a.*
, sum(Sales_Forecast) over (partition by product order by month ROWS BETWEEN CURRENT ROW AND 2 FOLLOWING) as Three_Month_Fixed_forecast
from
(
    select s.*
    , case
    when product = 1 then 4
    when product = 2 then 3
    when product = 3 then 2
    end as Stock_Target_Months
    from `Sales_Forecast`s
) a
 order by product, Month
Which gives us this output
But we want to be even more dynamic than this
We want to have the number of months forward vary by the setting at product level
Calculating a dynamic forward stock cover
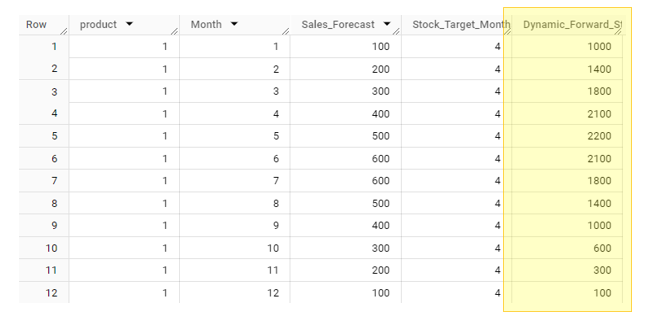
We need to number of rows to adjust based on the number of target months, so we use a case statement to select which option
Now the case statement looks at the setting on the stock target months and selects the approprite calculation
select a.*
, case
    when Stock_Target_Months = 1 then Sales_Forecast
    when Stock_Target_Months = 2 then sum(Sales_Forecast) over (partition by product order by month ROWS BETWEEN CURRENT ROW AND 1 FOLLOWING)
    when Stock_Target_Months = 3 then sum(Sales_Forecast) over (partition by product order by month ROWS BETWEEN CURRENT ROW AND 2 FOLLOWING)
    when Stock_Target_Months = 4 then sum(Sales_Forecast) over (partition by product order by month ROWS BETWEEN CURRENT ROW AND 3 FOLLOWING)
    else 0 end as Dynamic_Forward_Stock_Target
from
(
    select s.*
    , case
    when product = 1 then 4
    when product = 2 then 3
    when product = 3 then 2
    end as Stock_Target_Months
    from `Sales_Forecast`s
) a
 order by product, Month
The output now gives us the forward sotck cover we are looking for
Benefits of using Forward Stock Cover
Carrying the optimal stock holding
Preventing shortages or over stocks
Improving cashflow and profitability
Improved customer satisfaction by maximising availability within capacity constraints
Conclusion
Now you know why you need to use forward stock cover, and how to calculate it
By breaking down the steps to calculate the forward stock cover, you can also see how the SQL window functions can be used to calculate :-
Product Sub Totals
Product RUNNING totals
Product ROLLING totals
and finally, the Dynamic Forward Stock Cover
Subscribe to our channel to see more tips and timesavers
Select Distinct YouTube Channel
Or find other useful SQL, Power BI or other business analytics timesavers in our Blog
Our Business Analytics Timesavers are selected from our day to day analytics consultancy work. They are the everyday things we see that really help analysts, SQL developers, BI Developers and many more people.
Our blog has something for everyone, from tips for improving your SQL skills to posts about BI tools and techniques. We hope that you find these helpful!


