If you’re just starting out with Power BI, filters can seem confusing but they’re simply tools that control what your audience sees.
Visual, Page, and Report‑level filters each work at a different “scope,” and once you understand that everything clicks into place.
In this guide, you’ll learn what each filter does, when to use it, and how to keep your reports clear and focused without overthinking the choices. If you want to ensure your overall report architecture is following industry best practices, our Power BI consulting can provide expert clarity on your specific setup.
Why Filters Matter
Power BI visuals are only as good as the data behind them.
Filters allow you to:
- Narrow your focus without editing your dataset
- Build consistent pages without repeating work
- Apply global rules across an entire report
- Protect sensitive data
- Create tailored experiences for different audiences
Think of filters as the “scope settings” of your report. They decide what’s in frame and what’s left out.
Power BI gives you three scopes to work with:
- Visual-level filters
- Page-level filters
- Report-level filters
Each filter works at a different level of your report, and choosing the right one keeps your dashboard clear and purposeful.
1. Visual-Level Filters
Scope: One visual only
Best for: Highlighting, isolating, or shaping a single chart or card
Visual‑level filters control only one chart at a time. They’re great when you want that chart to show a clear, specific message without influencing anything else.
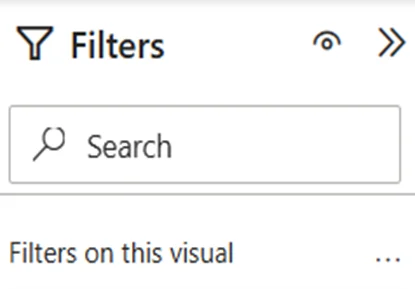
How they work
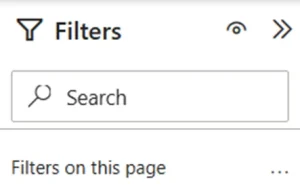
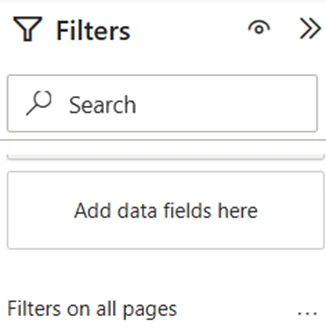
You select a visual → open the Filters pane → apply your filter.
Only that visual changes.
Example
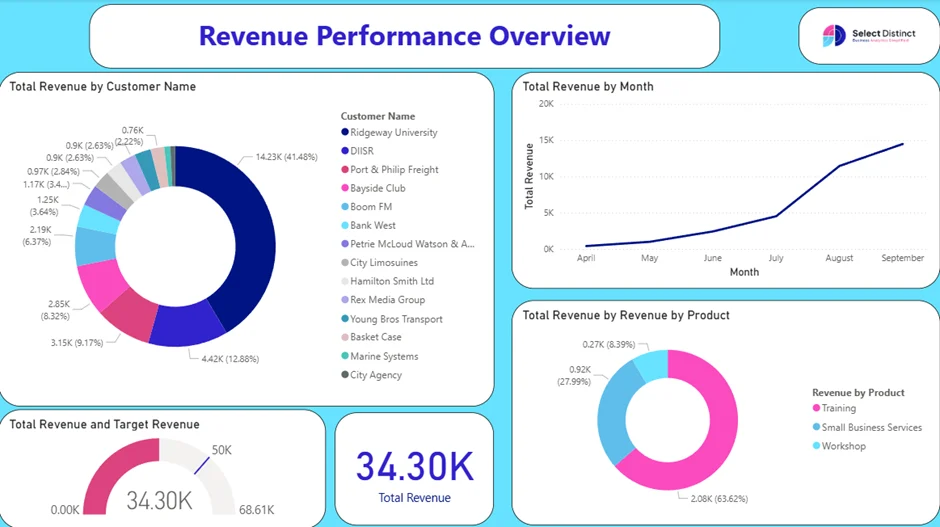
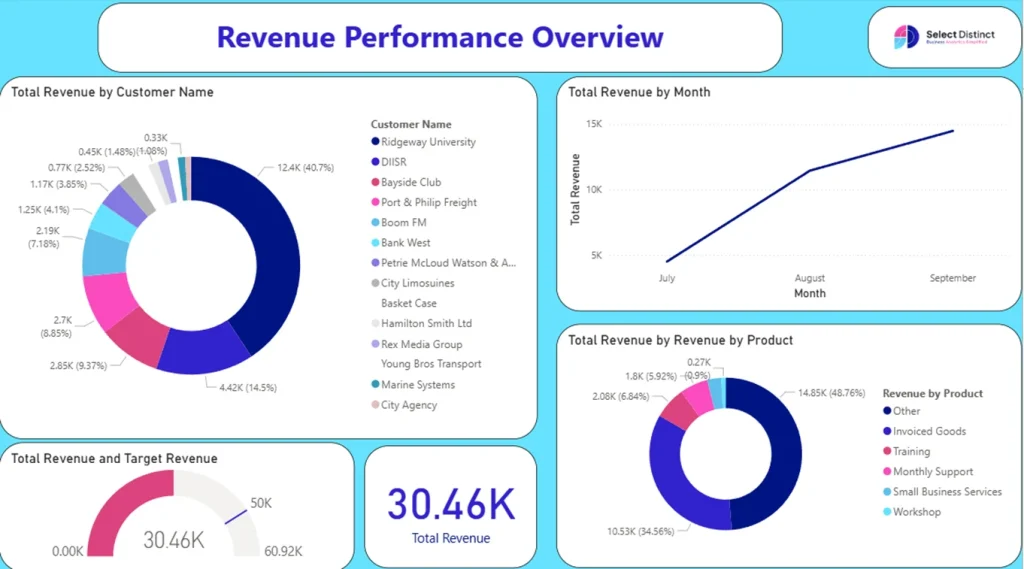
You’re working on your Revenue dashboard.
You want one donut chart to show only the Top 3 Revenue‑Generating Products, while the rest of the visuals continue to show the Total Revenue across all products.
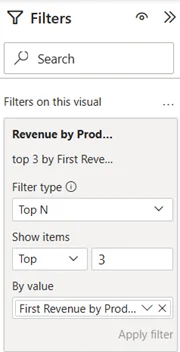
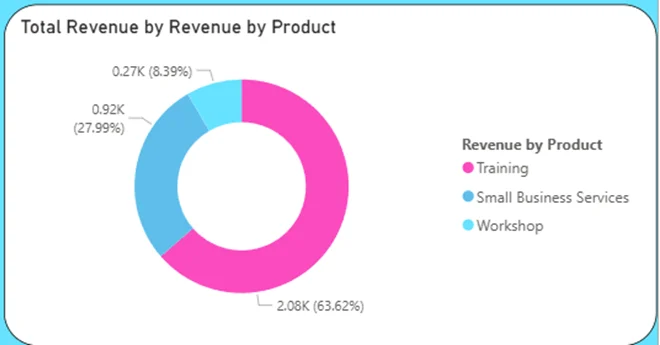
A visual‑level filter lets you isolate just that one chart, so it tells a focused story, without changing anything else on the page.
When to use visual-level filters
- Creating comparison visuals (e.g., “Online vs In‑Store”)
- Highlighting a specific product, region, or category
- Showing Top N or Bottom N lists
- Filtering a KPI card to a single metric segment
- Building “spotlight” visuals that draw attention
Visual-level filters are also great for teaching beginners because they demonstrate how filtering affects only one element
2. Page-Level Filters
Scope: Every visual on a single page
Best for: Themed pages, consistent filtering, and reducing repetitive work
How they work
You apply a filter at the page level → every visual on that page updates → other pages remain unchanged.
Example
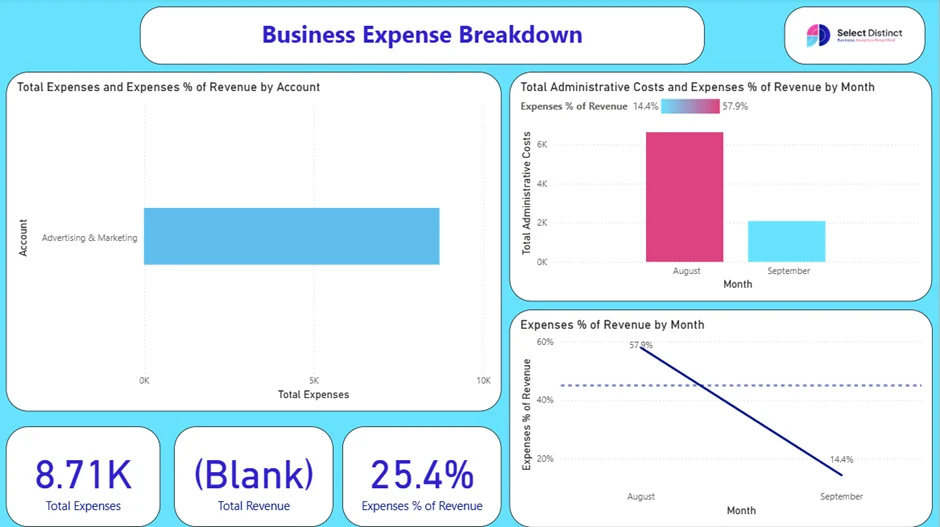
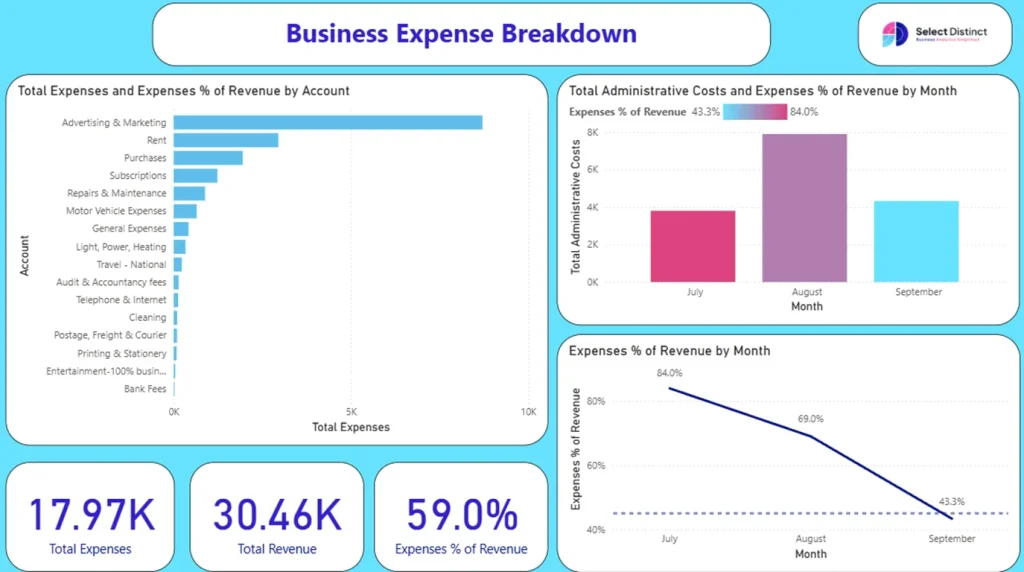
You’re working on your Expense page and notice Advertising & Marketing is becoming a high cost.
You want every visual on that page to focus on that one expense category.
Instead of filtering each visual one by one, you apply a page‑level filter for Expense Type = Advertising & Marketing.
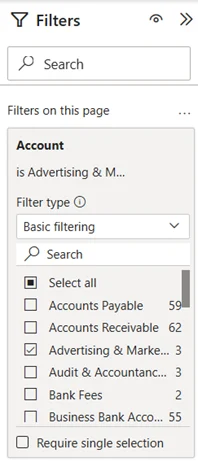
All visuals on that page update together, while your P&L and Revenue pages stay the same.
When to use page-level filters
- Creating year-specific or region-specific pages
- Ensuring consistency across multiple visuals
- Reducing repetitive filtering
- Restricting sensitive data on a single page
- Building “topic pages” like:
- Customer Overview
- Returns & Issues
- Product Performance
Page‑level filters are great for beginners because they show how a whole page can share the same filter settings.
3. Report-Level Filters
Scope: Every page in the entire report
Best for: Global rules, client-specific filtering, and security
Report-level filters apply across the whole report. Once set, they affect every page and every visual unless overridden.
How they work
You apply a filter at the report level → every page inherits it → the entire report becomes consistent.
Example
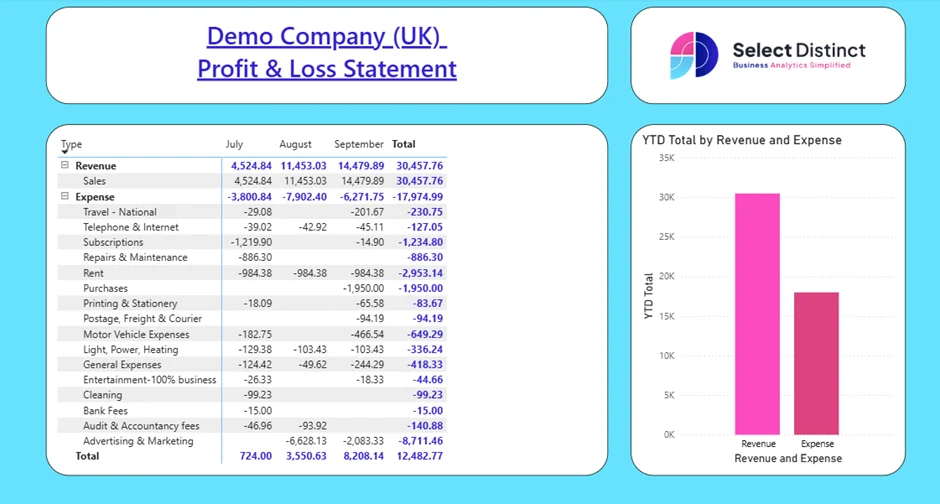
You’re reviewing performance for the end of the quarter, so you want your entire report — P&L, Expense, and Revenue pages — to show only the months July, August, and September.
Instead of filtering each page separately, you apply a report‑level filter for:
Month = July, August, September
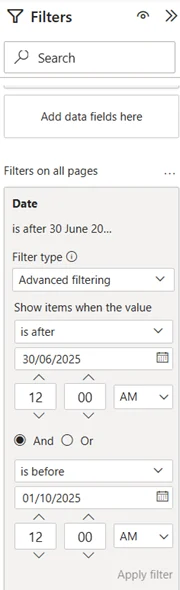
Now every page automatically shows data for those three months only, keeping the whole report aligned and preventing earlier months from appearing anywhere.
Page 1
Page 2
Page 3
When to use report-level filters
- Client-specific or department-specific reports
- Applying global rules (e.g., Country = “UK”)
- Ensuring consistent filtering across all pages
- Reducing risk of accidental data exposure
- Creating “template reports” that you duplicate for different audiences
Report‑level filters work across the entire report and are great for keeping sensitive data out of view without relying on slicers or user choices.
Choosing the Right Filter Level: A Quick Comparison
| Filter Level | Affects | Best For |
| Visual | One visual | Highlighting or isolating data |
| Page | All visuals on a page | Themed pages, consistent filtering |
| Report | Entire report | Client/department filtering |
Optional – Filter Pane Visibility
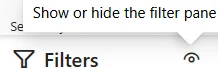
When you publish or share a report, viewers don’t need to see the filter pane unless you want them to interact with it.
In View mode, you can hide the filter pane so your audience focuses only on the visuals, not the setup behind them.
This keeps the page clean and avoids confusion for users who aren’t familiar with Power BI’s filtering options
Final Thoughts
Power BI filters aren’t complicated once you understand the three levels.
Visual, Page, and Report‑level filters each control a different part of your report and using them together helps you keep everything clear and consistent.
Start small, practice each filter type, and you’ll quickly build reports that feel organised, accurate, and easy for anyone to understand.
If you’d like to explore more:
Head over to our Business Analytics Blog for insights, walkthroughs and scenario-driven guides
Or our Power BI Glossary for clear, beginner friendly definitions