Introduction to the PIVOT function in SQL
The PIVOT function in SQL can be used to create a dataset with aggregated rows from a list of data
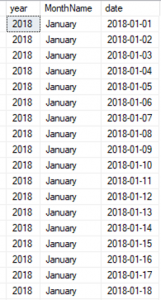
This post shows you how to transform a table of data like this
Into a summary table of data with a column representing each month
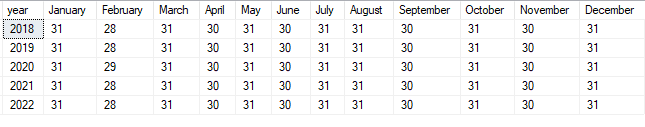
If you are familiar with Pivot tables in Excel you will notice that this looks similar
Creating a PIVOT table in SQL can be very useful if you need to work with a summary of data and do comparisons across columns
How to create a PIVOT table in SQL
(SQL Pivoting)
In our example we will start with the simple list of dates
select year, MonthName, date
from [dbo].[DimDate]
where year in (2018, 2019, 2020, 2021, 2022)
(In reality you wouldn’t use a list of dates, but in this example it makes it simple to see how it works)
Syntax of the SQL PIVOT function
select * from
(
select year, MonthName, date from [dbo].[DimDate]
where year in (2018, 2019, 2020, 2021, 2022)
) a
PIVOT
(count(date)
for Monthname in
(January, February, March, April, May, June, July, August, September, October, November, December)
) b
Breaking this down,
PIVOT
(count(date) –> this sets the aggregation to be a simple count of dates in our SQL PIVOT table
for Monthname in
(January, February, March, April, May, June, July, August, September, October, November, December) –> this defines the values to analyse, these are explicitly defined. We do not not have to return a column for each month, and we can set the order as we choose
Use cases for SQL Pivoting
SQL Pivot is a great solution when you need to be able to see data over a range of columns, giving you the ability to transform data orientation from Portrait to landscape
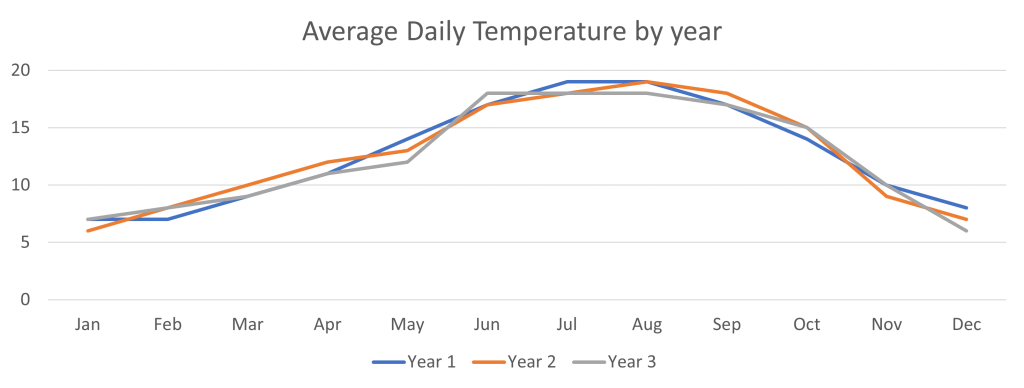
A common example we use often is when analysing seasonality
Analysis of seasonality is based around having a fixed number of data points within a year so lends itself well to using this method. It could also be used to capture sales of a product category over weeks of the year, seeing seasonal increases and decreases over a range of years
SQL pivoting is worth spending the time learn, bringing the power to transform data in summary tables to make analysis easier
You may be interested in How to create Pivot Tables in Excel
Subscribe to our channel to see more tips and timesavers
Select Distinct YouTube Channel
Or find other useful SQL, Power BI or other business analytics timesavers in our Blog
Our Business Analytics Timesavers are selected from our day to day analytics consultancy work. They are the everyday things we see that really help analysts, SQL developers, BI Developers and many more people.
Our blog has something for everyone, from tips for improving your SQL skills to posts about BI tools and techniques. We hope that you find these helpful!