This post explains how to sync slicers in Power BI, without any complex code
Slicers are an excellent way to give your users the ability to explore data, allowing users to use the slicers to filter the data down to particular information of interest. But, if your data has different data sets with common values e.g. a week number, you would need to either
1. Create a relationship between the data sets
or
2. Enable Sync Slicers to keep different data sets aligned
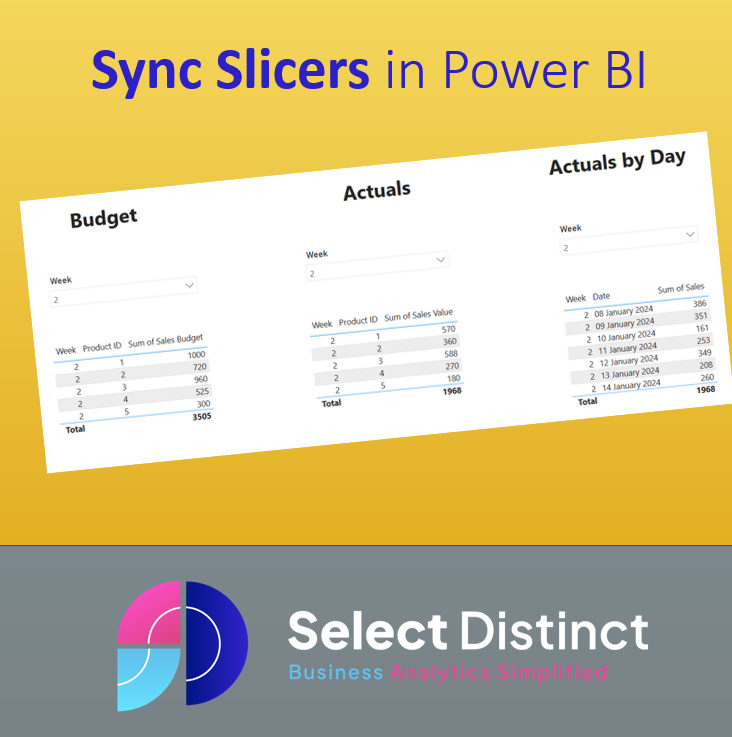
In our example here we will show how you can use the sync slicers across three different data sets
1. A Sales Budget
2. A Weekly Sales Summary
3. A Daily Sales Data Set
Each of these have a common field called week number
If you want to follow the step by step guide, you can download this Excel file with sample data
Sync Slicers Data
Step By Step Guide to Sync Slicers in Power BI
Step 1 – Download the data
Download the Excel file above.
It contains three tables
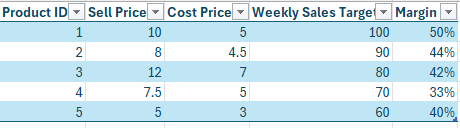
Products
A list of product IDs with fictional Sell Prices and Costs
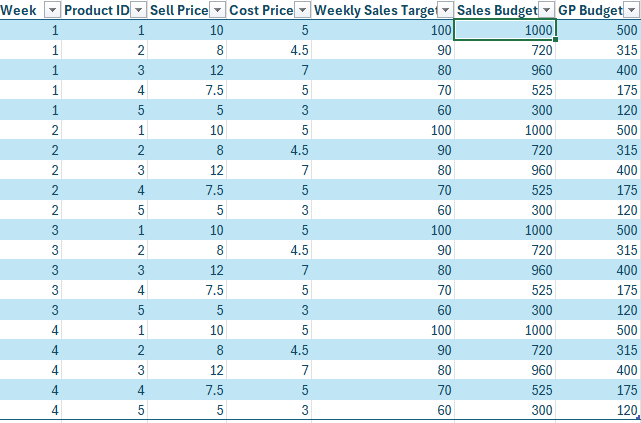
Budget
A simple list of weekly budgets by product, with five products and just four weeks for our example
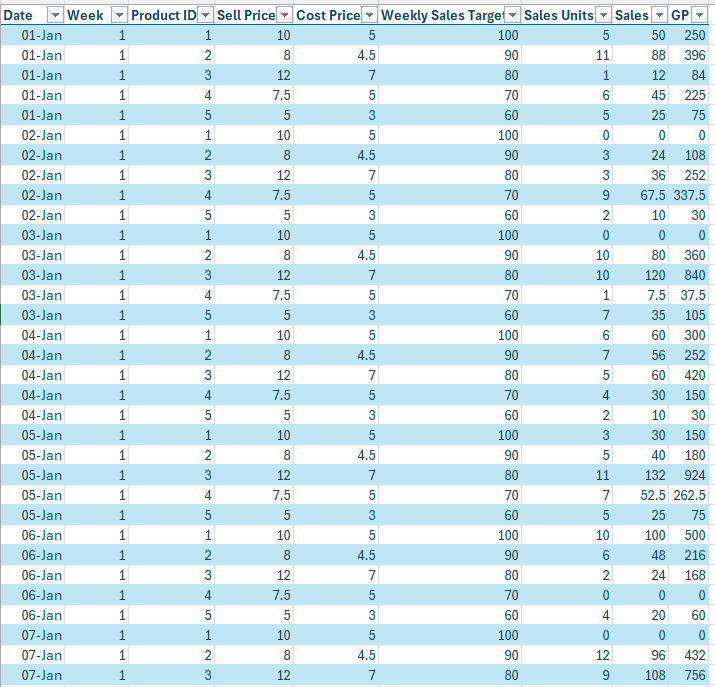
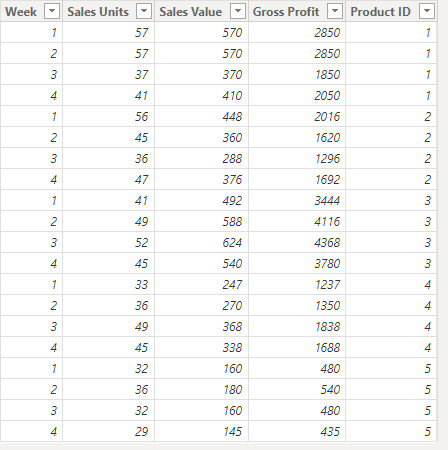
Actuals
A randomised fictional data set with the same five products and four weeks but with daily sales being calculated with a random factor applied to the Sales Units
Step 2 – Load the data into Power BI Desktop
Open Power BI Desktop
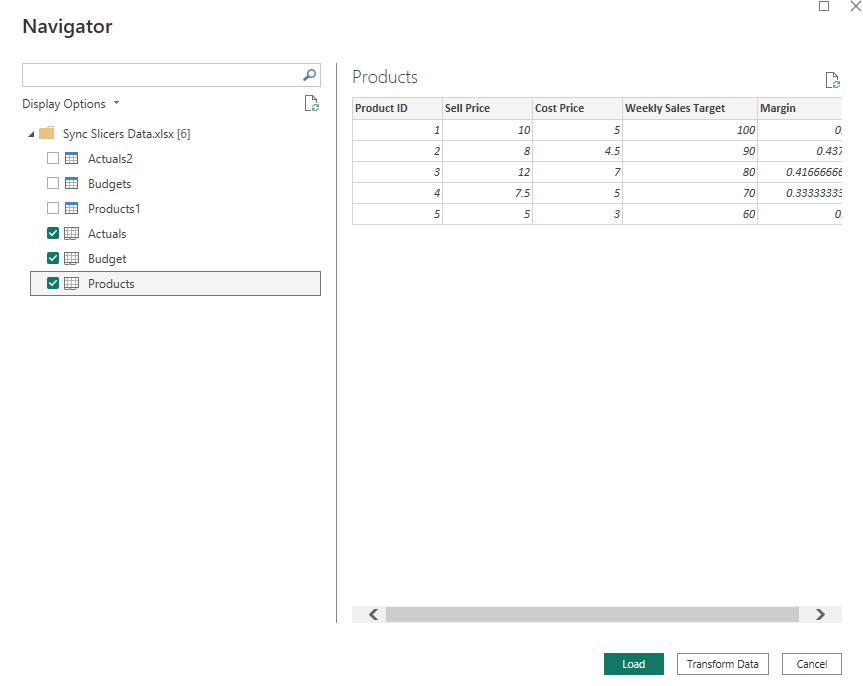
Click Get Data and select your excel file, wherever you saved it
The data sets in the file are formatted as tables already, so select the bottom three options, then click load
Step 3 – Add a weekly summary table using DAX SUMMARIZE
Go to the table view, and click new table, then use the DAX code to create the new table
Actuals Summary =
SUMMARIZE
(
Actuals
, Actuals[Week], Actuals[Product ID]
, "Sales Units", Sum(Actuals[Sales Units])
, "Sales Value", Sum(Actuals[Sales])
, "Gross Profit", Sum(Actuals[GP])
)
The DAX SUMMARIZE function is a great way to create a table of sub totals. In this example our budgets are at a by product by week level. So it makes sense to compare our actual sales to the same level of granularity
How SUMMARIZE Works in this example
Actuals Summary is the name for the new table
SUMMARIZE( is the starting point for the function
Actuals tells the SUMMARIZE function which table we want to summarise
, Actuals[Week], Actuals[Product ID], This tells the SUMMARIZE function to summarise by the week and product id fields, in our example we want a by week, by product total for sales, units and gross profit
“Sales Units”, Sum(Actuals[Sales Units]), “Sales Value”, Sum(Actuals[Sales]), “Gross Profit”, Sum(Actuals[GP]). These are the fields that we want to create the aggregated values for. Here we set each column and name as well as tell it to use the SUM function
When you press enter the DAX runs and creates the new table
Step 4 – Add the tables and slicers to the Power BI canvas
Create three simple tables from the Budget, Actuals Summary and the Actuals data sets
For the budget we used the Week, Product ID and Sum of Sales Budget
Then for the Actuals Summary, we used the same with Week, Product ID and Sum of Sales Value
and finally to show the sales by day, we used the Week, the Date and the Sum of Sales
Then for each of those add a seperate slicer for each of the three data sets, using the Week field
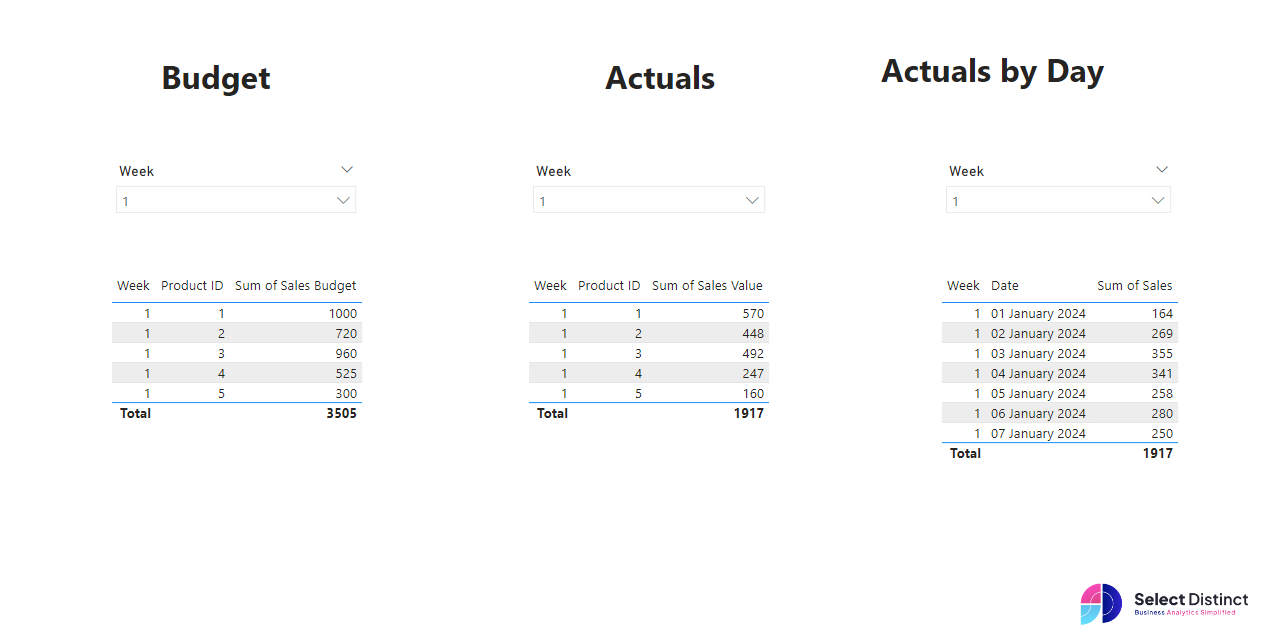
At this point the slicers all operate independently of each other
Final Step – Sync Slicers
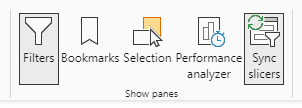
To get the slicers to stay in Sync, go to the View ribbon
On the right hand side in the Show Panes section, select the Sync Slicers button
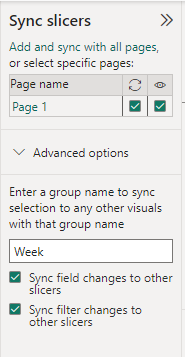
The Sync Slicers Panel appears
With the first slicer selected, looks for the advanced options and hit the chevron
Then, in the group name box type the name ‘Week’
Ensure both the options below are also ticked
We have created a group called Week, and we will use this to group the other slicers into the same group
Now select the next slicer and enter the same group name in the Sync Slicers panel.
And repeat it for the third Slicer too
Now when you select any of the weeks on any of the slicers all three of them are kept in sync
Here is the dashboard embedded in this page so you can see how it works
Conclusion
Having the ability to sync slicers across different data sets when the data is at a different level of granularity is really useful
We find that users find this very convenient and it is fairly simple to set up
Subscribe to our channel to see more tips and timesavers
Select Distinct YouTube Channel
Explore more design tips in our Dashboard Design & BI Tools and How-To Guides, or Contact Us for hands-on help.