How to Use SAMEPERIODLASTYEAR in Power BI
SAMEPERIODLASTYEAR in Power BI is great way to simplify the analysis of year over year performance
One of the most common tasks in data analysis is to compare performance over time. While functions like SAMEPERIODLASTYEAR simplify this, setting up the underlying calendar tables correctly is a foundational decision for your data strategy. If you need expert clarity on your setup, our Power BI consulting and Power BI mentoring can help you navigate these complexities and build professional-grade reports
Power BI offers several time intelligence functions that can help you perform these comparisons easily and accurately. In this blog post, we will focus on one of them: SAMEPERIODLASTYEAR.
What is SAMEPERIODLASTYEAR?
SAMEPERIODLASTYEAR is a DAX function that returns a table that contains a column of dates shifted one year back in time from the dates in the specified dates column, in the current context. For example, if you have a table of sales data with a date column, you can use SAMEPERIODLASTYEAR to get a table of sales data from the same period last year.
The syntax of SAMEPERIODLASTYEAR is:
SAMEPERIODLASTYEAR(<dates>)
Where dates is a column containing dates.
How to Use SAMEPERIODLASTYEAR?
You can use SAMEPERIODLASTYEAR in various ways to create different types of comparisons. Here are some examples:
Example 1: Compare Sales This Year vs Last Year
Let’s say you have a table called Sales that contains the following columns:
OrderDate: The date of the orderSalesAmount: The amount of the orderProduct: The product name
You want to create a measure that calculates the total sales amount for this year and another measure that calculates the total sales amount for the same period last year. You can use SAMEPERIODLASTYEAR with CALCULATE to do this:
Sales TY = CALCULATE(SUM(Sales[SalesAmount]), ALL(Sales))
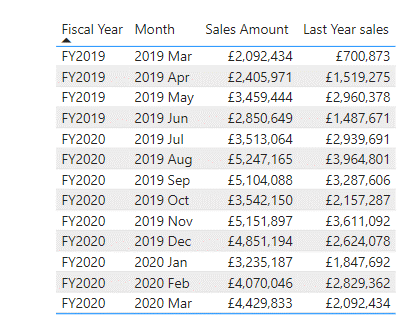
Sales LY = CALCULATE(SUM(Sales[SalesAmount]), SAMEPERIODLASTYEAR(Sales[OrderDate]))
The first measure, Sales TY, uses ALL to ignore any filters on the Sales table and calculate the sum of sales amount for all dates. The second measure, Sales LY, uses SAMEPERIODLASTYEAR to filter the Sales table by the same dates as the current context, but one year earlier, and calculate the sum of sales amount for those dates.
You can then use these measures in a visual, such as a line chart, to compare the sales trends over time:
Example 2: Compare Sales Growth Rate This Year vs Last Year
You can also use SAMEPERIODLASTYEAR to calculate the percentage change in sales from last year to this year. To do this, you can use the following formula:
Sales Growth Rate = DIVIDE([Sales TY] - [Sales LY], [Sales LY])
This measure subtracts the sales amount for the same period last year from the sales amount for this year, and divides it by the sales amount for the same period last year. This gives you the percentage change in sales.
You can then use this measure in a visual, such as a card, to show the sales growth rate:
Example 3: Compare Sales by Product This Year vs Last Year
You can also use SAMEPERIODLASTYEAR to compare the sales by product category or subcategory. To do this, you can create two measures that calculate the sales amount by product for this year and last year, using SAMEPERIODLASTYEAR with CALCULATE and FILTER:
Sales by Product TY = CALCULATE(SUM(Sales[SalesAmount]), ALL(Sales))
Sales by Product LY = CALCULATE(SUM(Sales[SalesAmount]), FILTER(SAMEPERIODLASTYEAR(Sales[OrderDate]), Sales[Product] = SELECTEDVALUE(Sales[Product])))
The first measure, Sales by Product TY, is similar to Sales TY, except that it does not ignore any filters on the product column. The second measure, Sales by Product LY, uses FILTER to apply an additional filter on the product column, so that it only includes the sales amount for the same product as the current context.
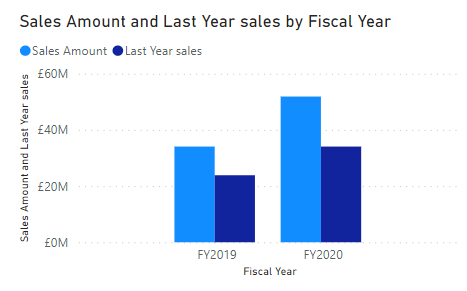
You can then use these measures in a visual, such as a clustered column chart, to compare the sales by product for this year and last year:
SAMEPERIODLASTYEAR in Power BI summary
SAMEPERIODLASTYEAR is a powerful and versatile function that can help you create meaningful and insightful comparisons over time. You can use it with other DAX functions and visuals to create various types of reports and dashboards.
I hope you found this blog post helpful and learned something new. If you have any questions or feedback, please leave a comment below. Thank you for reading!
You may also be interested in reading Comparing Year on Year in Power BI . This post provides a more controllable alternative
Ready to compare performance year-over-year?
Explore more in Data Analytics & Business Intelligence and Dashboard Design & BI Tools
Learn key terms like SAMEPERIODLASTYEAR in our DAX Glossary
For broader strategy, visit our Business Analytics Blog
Subscribe to our channel Select Distinct YouTube Channel to see more tips and timesavers