
Handling large volumes of mailbox data can quickly become overwhelming, especially when you’re trying to analyse patterns, track communication behaviour, or build organisation-wide insights. Fortunately, Excel’s Power Query provides a powerful, repeatable, and user‑friendly way to transform mailbox data into a clean, analysis‑ready structure — no coding required.
In this guide, we’ll walk through exactly how to load existing mailbox data into Excel using Power Query, transform the columns, clean up senders and recipients, and build a dataset ideal for dashboards or reporting. Whether your source data comes from Outlook, Exchange, or a compliance tool, the steps below will give you a consistent and efficient framework.
Why Power Query Is the Best Tool for Mailbox Analysis
Mailbox datasets are rarely perfect.
They often contain:
- Duplicate fields
- Unstructured folder paths
- Mixed time formats
- Boolean values stored as text
- Multiple versions of email addresses
- Extra whitespace or system values
Power Query is built for this. With it, you can:
- Clean all fields in seconds
- Split or merge columns
- Convert date/time formats
- Normalise email addresses
- Create reusable transformations
- Refresh data automatically
Once your steps are created, you never have to repeat manual clean up again — just refresh the query whenever new mailbox data is available.
Step 1: Load Mailbox Data Directly into Excel
Start by loading your mailbox file into Excel:
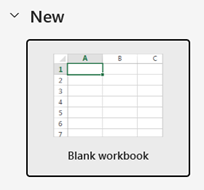
1.Open Excel → Blank Workbook
2. Go to the Data tab
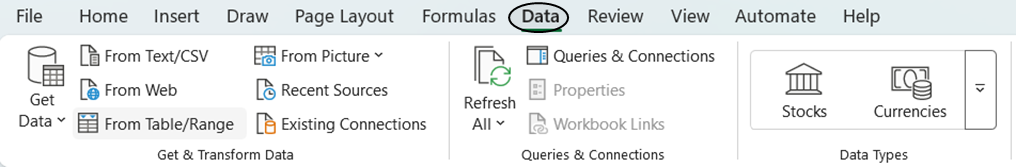
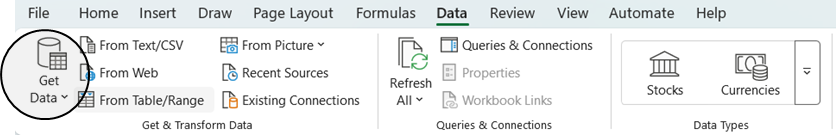
3. Select Get Data
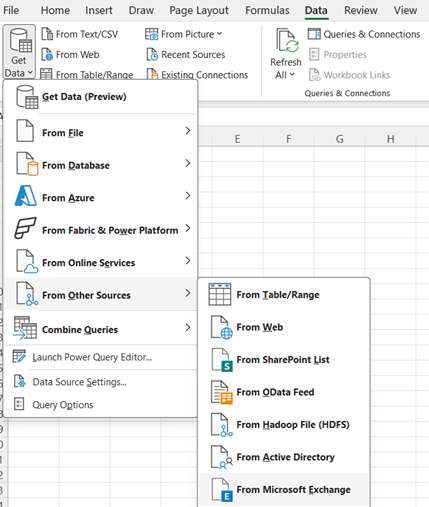
4. Choose From Other Sources → From Microsoft Exchange
5. Enter your Mailbox Address
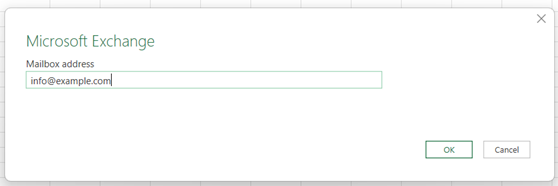
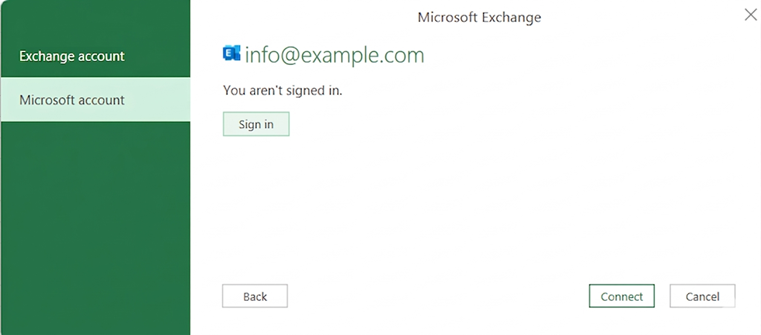
6. Sign-in if prompted to
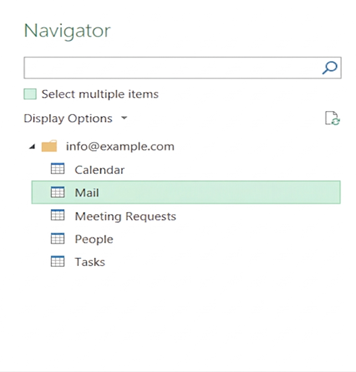
7. Click Mail table
8. Select Transform Data
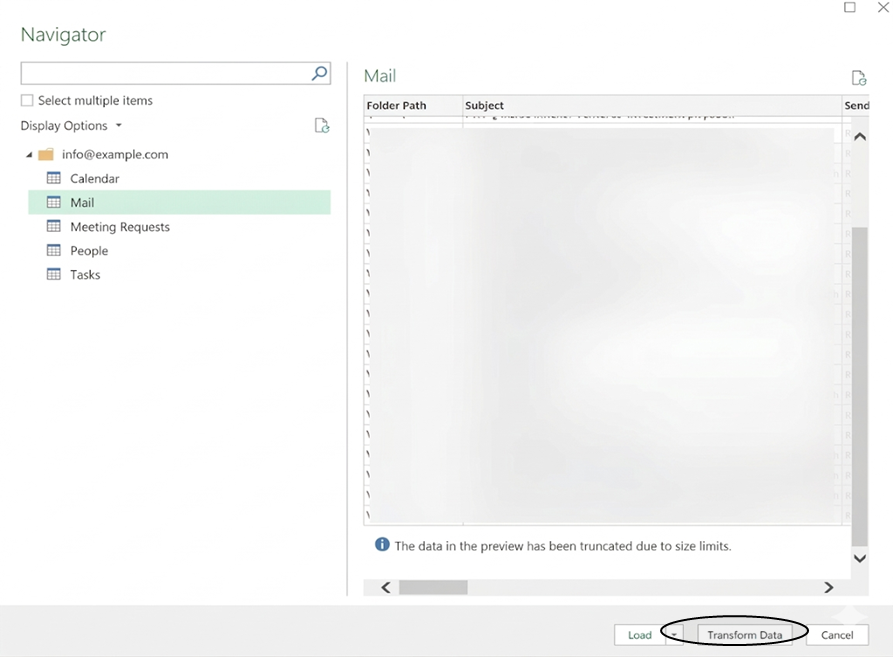
This opens the Power Query Editor, where all transformation steps will take place.
Step 2: Review & Format Column Headers
When your data loads, check that the headers appear correctly.
If Power Query hasn’t automatically promoted them:
Home → Use First Row as Headers
Next, set the appropriate data types
| DateTimeSent / DateTimeReceived | → | Date/Time |
| IsRead / HasAttachments | → | True/False |
| Importance | → | Text or Whole Number (depending on your source) |
| Subject, Sender.Name, etc. | → | Text |
Correct data types ensure accurate reporting and avoid issues in PivotTables later.
Step 3: Split the Sender Into Name and Email Address
Before analysing your mailbox data, it’s helpful to break the Sender record into separate Name and Email Address fields so each part can be used independently.
Mailbox data often includes the Sender column as a record containing two pieces of information:
- Name
- Address
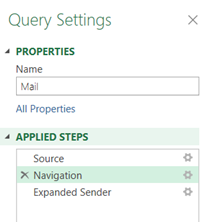
To separate these into their own columns, locate to Navigation (within Applied Steps):
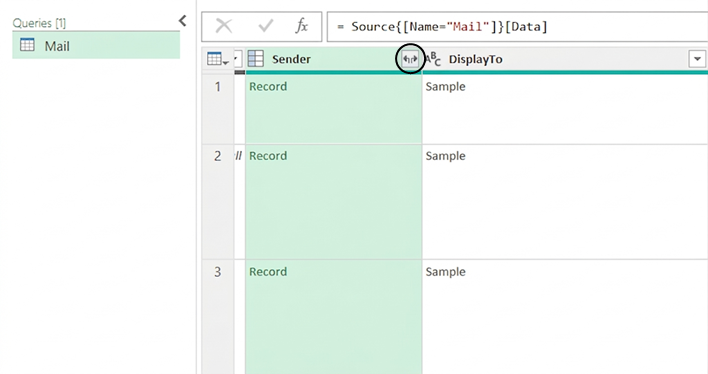
1.Click the expand icon (two arrows) beside the Sender column
2. In the menu that appears, tick the fields you want to extract:
- Name
- Address
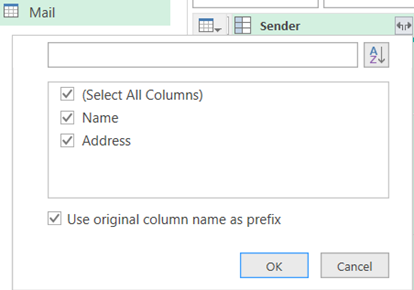
3. Select OK
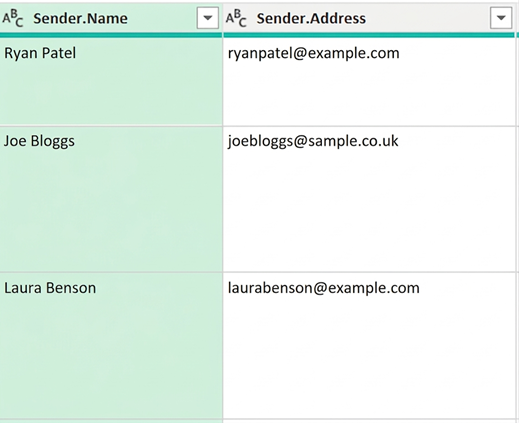
This will create two new columns, making it easier to filter, sort, and analyse sender information.
Step 4: Split the Email Address into Name and Domain
Once the Sender’s email address is available as a single text field, the next step is to split it into the mailbox name and the domain to make grouping and filtering much easier
You may want to separate the email address into two useful parts:
- The mailbox name (everything before the @)
- The domain (everything after the @)
To do this:
1.Select the Sender.Address column
2. Go to Home → Split Column → By Delimiter
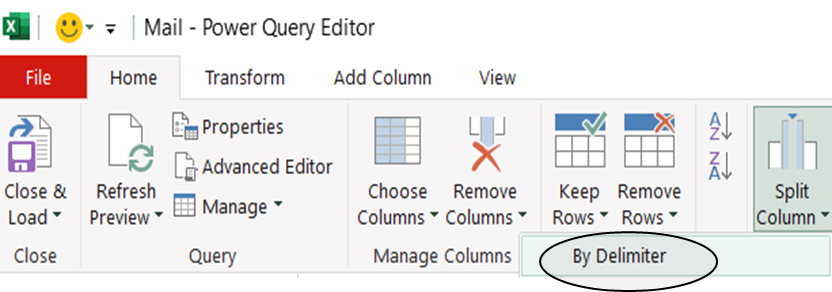
3. Choose @ as the delimiter
4. Select At the right-most occurrence of the delimiter
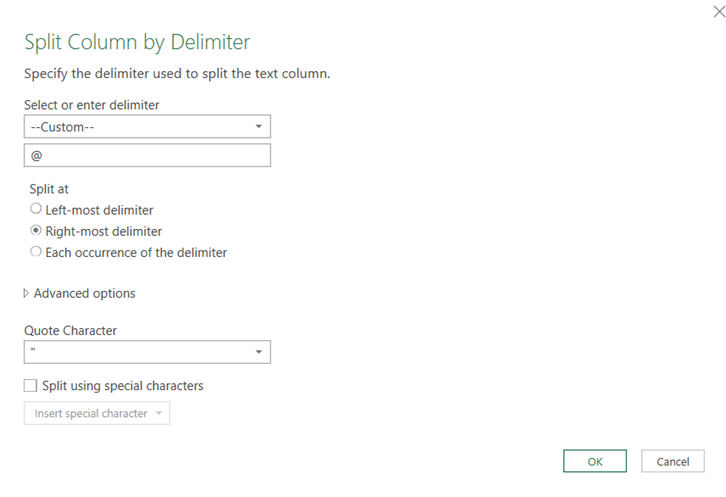
5. Click OK
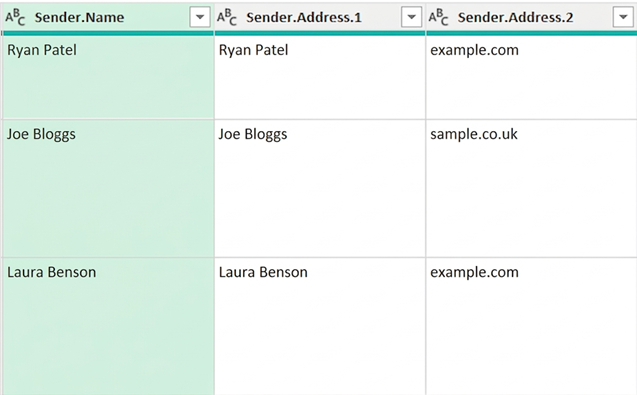
Power Query will create two new columns:
- Sender.Address.1 – the part before the @ (e.g. ryan.patel, joe.bloggs, laura.benson)
- Sender.Address.2 – the domain portion (e.g., example.com, sample.co.uk)
This makes it easy to group by mailbox name or analyse domain usage across your dataset.
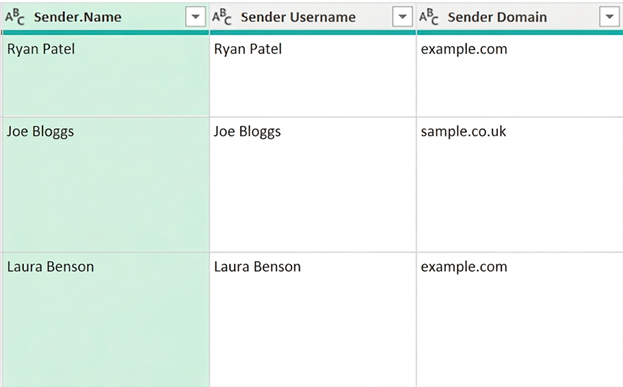
Optional: Rename the field names to a suitable name
Close and Load these changes in Power Query
Best of all, you can refresh this table anytime:
Data → Refresh All
Every transformation step will be applied to the updated mailbox file instantly.
Step 5: Analyse Your Data with a Pivot Table
Once your transformed mailbox data has been Closed & Loaded back into Excel, you can begin analysing it straight away. One of the quickest and most powerful ways to do this is by creating a Pivot Table.
A Pivot Table lets you easily group emails by sender domain, sender name, importance, dates, or any other fields you cleaned in Power Query.
To create a Pivot Table:
1.Click Add New Sheet in Excel

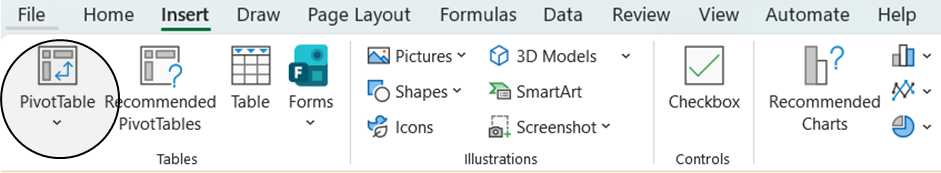
2. Go to Insert → PivotTable
3. Select the Data Table range
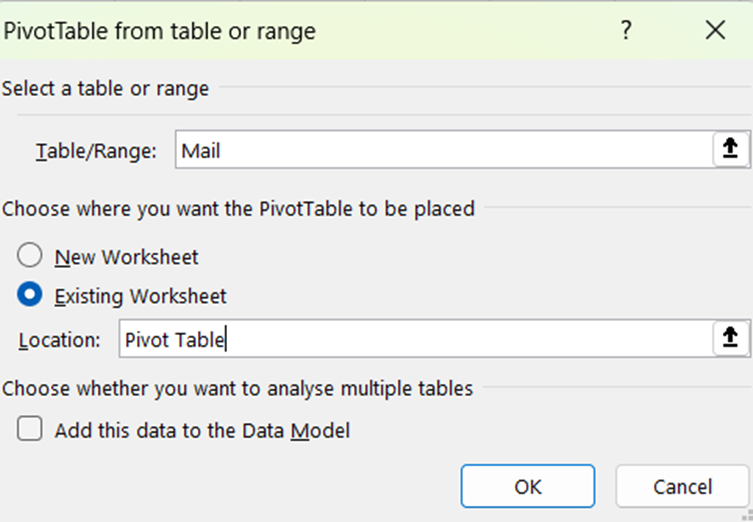
4. Click OK
Visualising Email Activity
You can build a visual breakdown of your email activity.
For example, to analyse which domains send you the most messages:
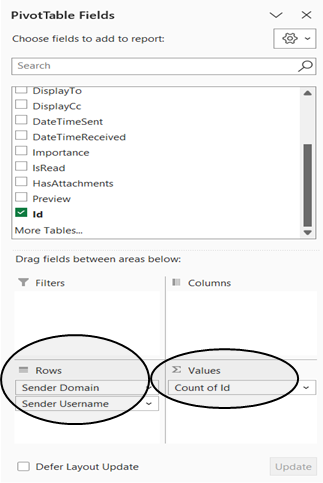
1.Drag & Drop Sender.Domain into the Rows area
2. Drag & Drop Sender.LocalPart underneath it
3. Drag Id into the Values area
4. Set Values to Count of Id
You can now sort these descending based on the Count of Id and see a summary like this:
- Top domains grouped together
- Individual mailbox names nested underneath
- A count of how many emails came from each sender
Click the + icon next to each domain to drill down into individual senders
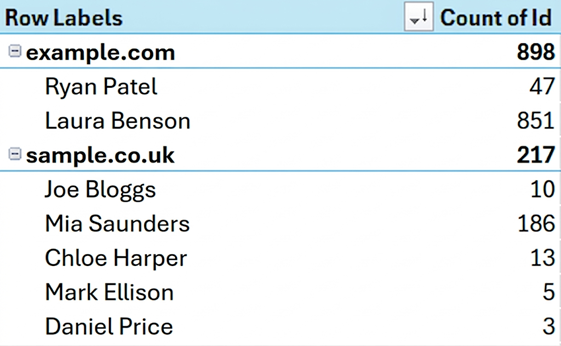
This provides an instant overview of where your email volume is coming from and highlights the most active senders in each domain.
This approach works beautifully when combined with the split fields you created earlier, letting you drill down from domain → mailbox → individual messages in just a few clicks.
Practical Use Cases
This approach to analysing mailbox data in Excel is useful in a variety of scenarios:
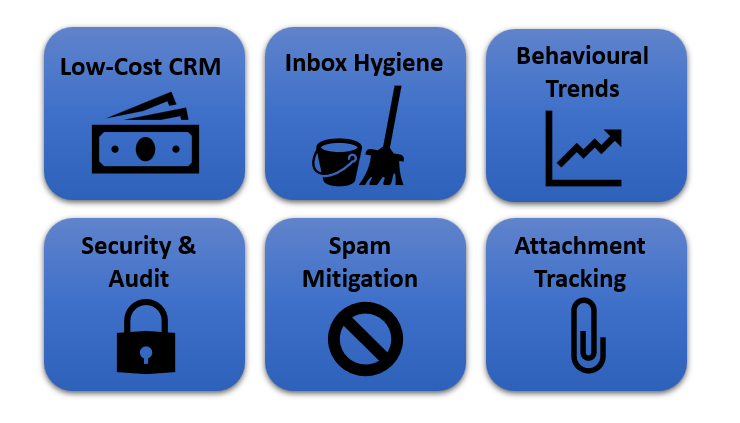
- Low-Cost CRM: Identify your most active customers and suppliers by message volume without needing specialized software
- Inbox Hygiene: Target “no-reply” senders and high-frequency newsletters to systematically reduce digital clutter
- Behavioural Trends: Map internal vs. external communication patterns to see exactly where your team’s time is spent
- Security & Audit: Detect sudden spikes in activity or unusual sender domains to perform light-touch compliance checks
- Spam Mitigation: Group by Sender.Domain to isolate and block persistent low-value sources at the root.
- Attachment Tracking: Filter by the HasAttachments field to monitor high-volume file transfers and ensure important client documents are never overlooked.
Final Thoughts
Power Query transforms messy mailbox data into a polished, reusable dataset you can analyse in minutes. By loading your mailbox file directly into Excel, performing structured cleanup, and refreshing it as needed, you eliminate repetitive manual work and build a reliable reporting pipeline.
This process can easily be extended with additional Power Query steps, dashboards, or automation depending on your needs.
Ready to take your data further?
Visit our Business Analytics Blog for more tips on automating your workflows and turning raw data into actionable insights