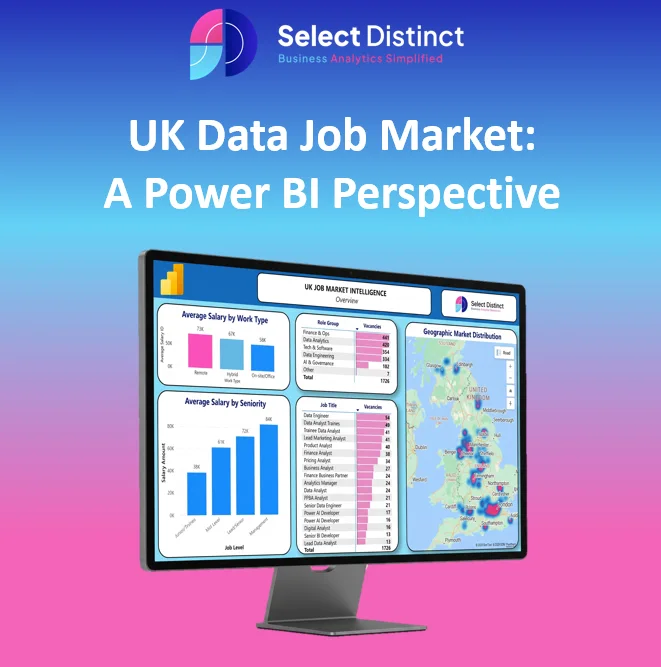
Live Vacancy Intelligence from Reed.co.uk
Navigating the job market today isn’t just about finding “a job”. It’s about understanding where the demand is so you can make a move that lasts.
To provide a clearer picture for those looking to advance their careers, we have analysed live data from Reed, focusing specifically on the high-impact roles that are currently shaping the UK economy.
The Demand Landscape: Where the Jobs Are
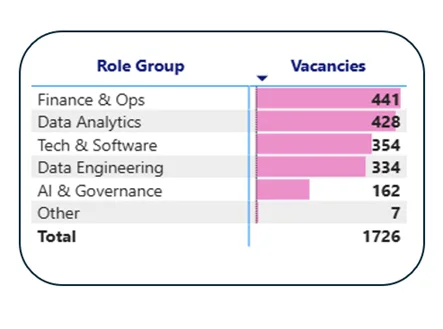
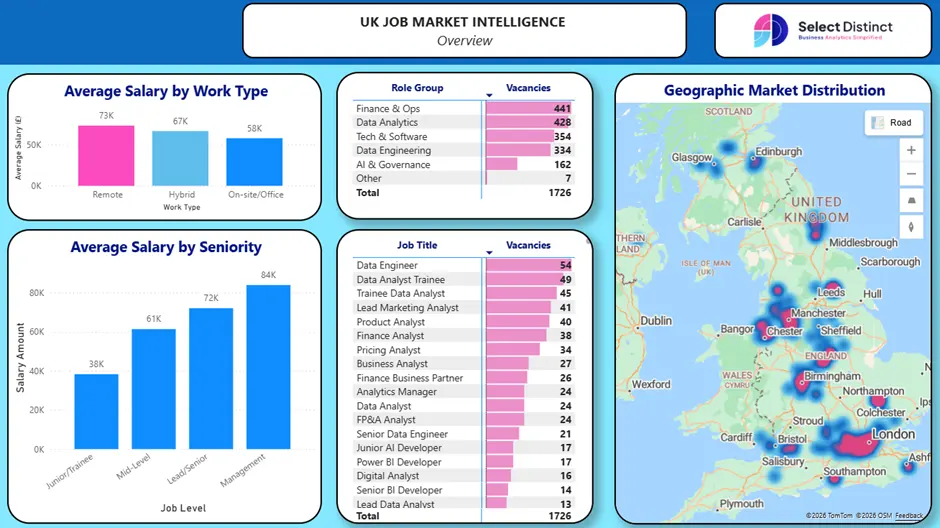
If you look at the numbers, the UK market is currently highly active, but the opportunities are concentrated in specific high-impact sectors. We are currently tracking 1,726 active vacancies, but they aren’t spread evenly.
- The Sector Leaders: Finance & Ops currently leads the pack with 441 vacancies, followed closely by Data Analytics at 428.
- The Technical Core: Demand for Tech & Software (354) and Data Engineering (334) remains robust. This shows that despite the noise around AI, businesses are still heavily investing in their underlying “plumbing”—the data infrastructure.
- Top Individual Roles: Companies are prioritising roles that bridge the gap between raw data and business value. The top advertised positions are Data Engineer (54 vacancies), Data Analyst Trainee (49), and Trainee Data Analyst (45).
The Work-Environment Premium: Remote and Hybrid Leads
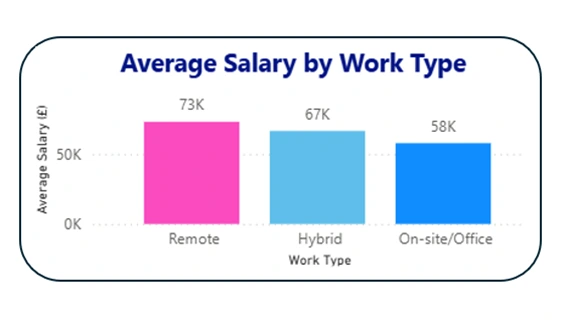
Despite the ongoing debate regarding a return to traditional office settings, the current data shows a clear financial advantage for flexible work arrangements. There is a measurable salary premium for roles that offer location independence, suggesting that the geographical location of an office is becoming less of a factor in determining pay scales.
- Remote Work Salaries: Remote positions currently command the highest average salary at £73K. This indicates that highly skilled specialists are successfully securing full flexibility while maintaining top-tier compensation.
- The Hybrid Balance: Hybrid roles average £67K. This remains a highly competitive option for those balancing office collaboration with home-based focus.
- On-site/Office Roles: These positions sit at the lower end of the spectrum, averaging £58K. This often reflects roles in more traditional industries or positions that require more direct, in-person supervision.
Regional Hiring: Significant Demand Outside London
While London remains a major market, the Geographic Market Distribution map shows that high-level opportunities are well-distributed across the UK. The data highlights significant hiring activity in several regional centres, offering strong career prospects without the need to be based in the capital.
There is a clear concentration of vacancies across the Manchester-Leeds-Sheffield corridor and the West Midlands. These areas have established themselves as independent hubs for specific sectors.
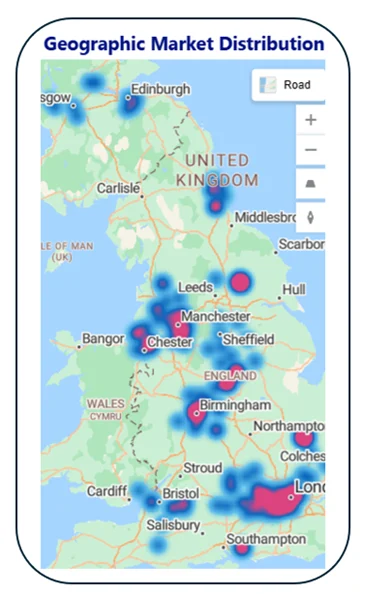
By identifying these regional centres on the dashboard, you can find competitive salaries and career stability in locations that match your professional goals.
How to Use the Overview to Your Advantage
To get the most out of the dashboard, don’t just look at the totals – interact with them:
- Role Group Filtering: Click on Data Analytics or AI & Governance (162 vacancies) to see how the vacancy volumes and job titles shift.
- Spot the Niche: Compare the high volume of Data Analysts to more specialised roles like Senior Data Engineer (21 vacancies) or Junior AI Developer (17 vacancies) to see where you can find less competition and higher demand.
- Salary Benchmarking: Use the Average Salary by Work Type chart to decide if that “London-weighted” on-site role is a better deal than a high-paying remote role based in the North.
The data shows a market built for immediate impact. Success right now isn’t about general applications; it’s about aligning your skills with the high-volume hotspots identified in this live intelligence.
Salaries: What the Market is Paying
The current data highlights that compensation varies significantly based on both technical expertise and the level of responsibility. By analysing live vacancies, we can see clear benchmarks for progression and how different work environments impact average pay.
Salary by Seniority
The transition between career stages shows a substantial increase in earning potential, providing a clear roadmap for professional growth:
- Junior/Trainee: Roles at this level currently average £32K.
- Mid-Level: A significant step up to £61K, representing a key area of market activity.
- Lead/Senior: Average compensation rises to £73K for those in more advanced technical or leadership positions.
- Management: Senior leadership roles command the highest averages at £85K.

Average Salary by Work Type
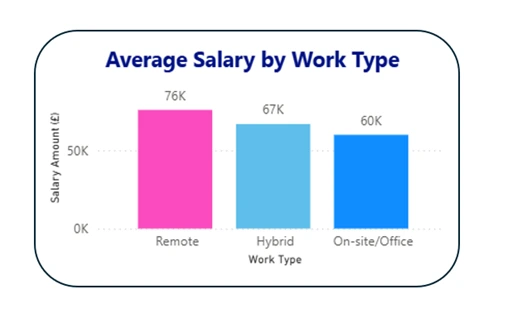
The data indicates that roles offering greater flexibility are currently associated with higher average salaries. This trend suggests that the ability to work from any location is a high-value feature in the current market, often associated with more senior or specialised positions.
- Remote Positions: These roles carry the highest average salary at £76K.
- Hybrid Arrangements: Roles that combine home and office working average £67K, maintaining a strong position in the market.
- On-site Roles: Positions based entirely in an office or at a specific site average £60K.
Quick Start: How to Use the Dashboard
1. Target Your Search
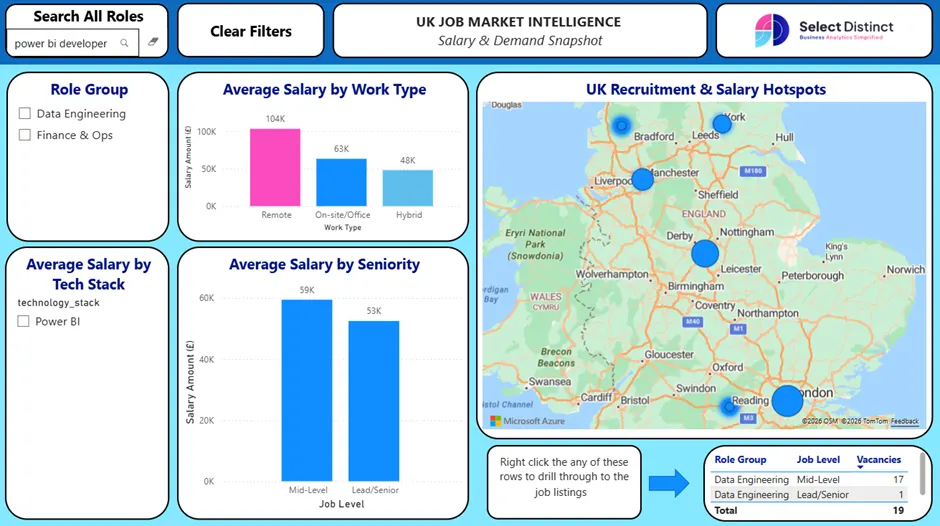
Use the Role Group filter or the Search bar to narrow the field.
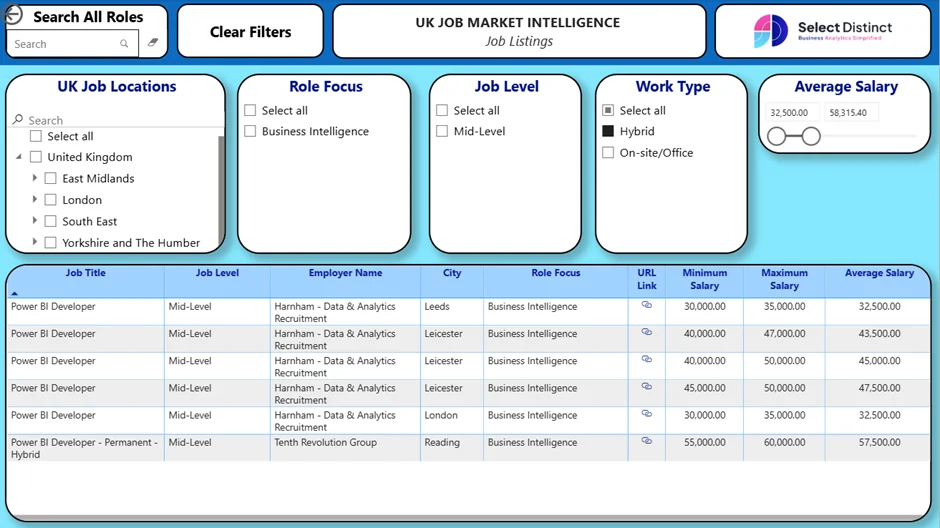
- Action: Type “Power BI Developer” into the search bar or select Data Analytics to instantly update every chart on the page with relevant roles.
2. Check Your Value
Use the Tech Stack and Seniority charts to see how Power BI skills impact pay.
- Tip: Select Power BI or Power BI, SQL in the Tech Stack list to see how these specific combinations compare to the national average salary.
3. Find Power BI “Hotspots”
The Heatmap updates as you filter, showing you where the demand for Power BI is highest.
- Action: Hover over the clusters to see which regions, such as London or the North West, have the most active vacancies for Power BI specialists.
4. See the Live Jobs
When you see a role group that interests you in the bottom-right table, Right-Click the row.
- Action: Select ‘Drill through’ to go from the high-level stats straight to the live Power BI job listings on dashboard
Location vs. Opportunity: Identifying Your Regional Safety Net
While London remains the primary market leader with 218 total volume, the Geographic Demand Snapshot shows that you do not need to be in the capital to build a high-level career. With over 2,000 total jobs across 181 hiring hubs, there is significant local demand across the North and the Midlands.
These regional clusters provide a professional “safety net.” If one role isn’t the right fit, the dashboard reveals dozens of other employers nearby looking for similar skills. This allows you to switch companies – or even move between industries like finance and tech – without needing to relocate.
How-to: Finding Yorkshire Opportunities (Example)
You can use the Geographic Demand Snapshot to narrow the national market down to your specific region and specialism:
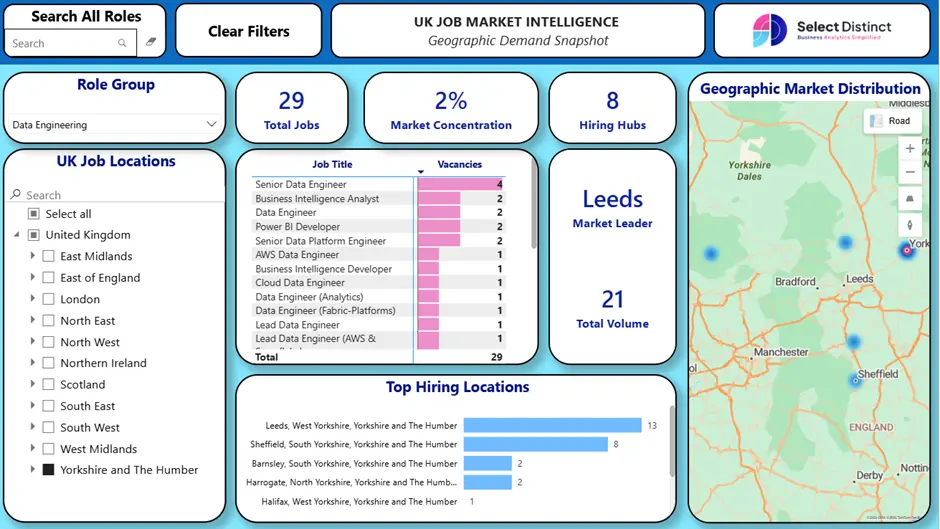
Filter by Region and Role: Select Yorkshire and The Humber and Data Engineering to see the 29 jobs matching your criteria.
Locate the Top Hubs: Check the Market Leader tile and Top Hiring Locations chart; Leeds leads with 21 vacancies, followed by Sheffield with 8.
Review Job Titles: Check the Job Title list for local needs; Senior Data Engineer is currently the top requirement in Yorkshire with 4 vacancies.
Visualise the Map: Use the Geographic Market Distribution map to see where hiring “heat” is concentrated, helping you plan your commute between hubs.
What’s Next: Mapping the Skills Gap
We are constantly enhancing our market intelligence tools to give you a clearer edge. Watch this space as we continue to develop the dashboard – our next major update will shift the focus to Skills-Based Intelligence. We are currently building a dedicated view that maps the specific technical requirements found in every live vacancy, allowing you to see exactly which tools and certifications are driving the highest salaries in real-time.

Conclusion: Navigating with Market Intelligence
The UK data market is currently built for immediate impact. Success isn’t about volume applications; it’s about aligning your career with live demand.
- Go Where the Jobs Are: You don’t need to be in London to thrive. Target regional “safety nets” like the Manchester-Leeds-Sheffield corridor for stability and competitive pay.
- Flexibility Pays: Remote roles command a significant premium, currently averaging £76K. High-level specialists are successfully trading the commute for top-tier compensation.
- Move with Intent: Use live benchmarks – like the £61K average for Mid-Level roles – to ensure you aren’t guessing your market value.
Stop guessing where the opportunities are.
Use this intelligence to target the right cities, the right roles, and the right salary.
Interact with our embedded Power BI Dashboard below
Click through to Reed to see the job adverts and apply