
Why your formulas behave differently in Power BI — and what that means for your business.
Have you ever tried rebuilding an Excel report inside Power BI, only to discover that the numbers don’t match? Or that the formulas you know like the back of your hand suddenly feel like a foreign language?
You’re not alone.
Excel is a great tool, but there’s a point where it stops helping you and starts holding you back. If you’re spending more time fixing broken spreadsheets than actually looking at your numbers, you’ve outgrown your current setup. The difference between struggling with rows and succeeding with insights often comes down to one big shift: how you handle your formulas.
Excel and DAX might look similar—they even share familiar functions like SUM, AVERAGE, and IF. But under the hood, they work in totally different ways. The biggest hurdle for most people moving to Power BI isn’t the software itself; it’s unlearning the ‘cell-by-cell’ thinking they’ve used in Excel for years.
At Select Distinct, we help UK businesses bridge that gap – turning your spreadsheet experience into the kind of scalable, interactive reports that actually help your business grow
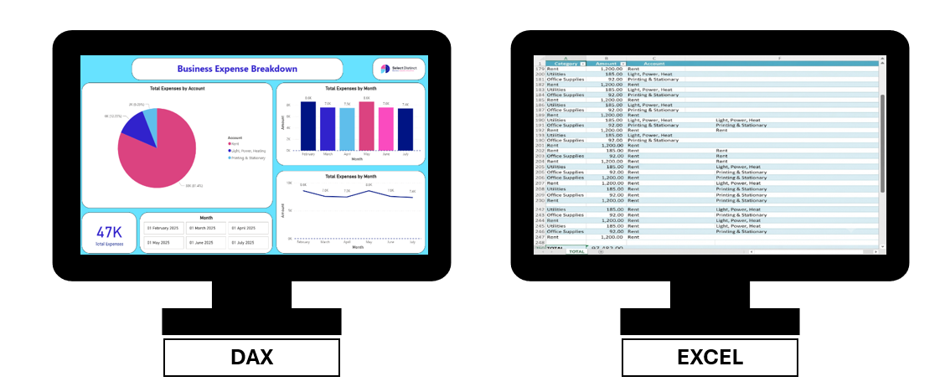
Let’s break down the core differences between Excel and DAX. Understanding why they work differently is the key to leaving the ‘spreadsheet chaos’ behind and building truly scalable reporting
Excel Formulas: Cell-Based Thinking
In Excel, your calculations live inside specific cells. Your formulas act like a chain reaction – everything is linked to a specific position on the grid, and if you move or change one piece, the whole chain must be updated
How Excel Works
In Excel:
- You write formulas that reference positions (A1, B2, C10:C200).
- Calculations depend on rows, columns, and sheet layout.
- You build spreadsheets by manually connecting cells together.
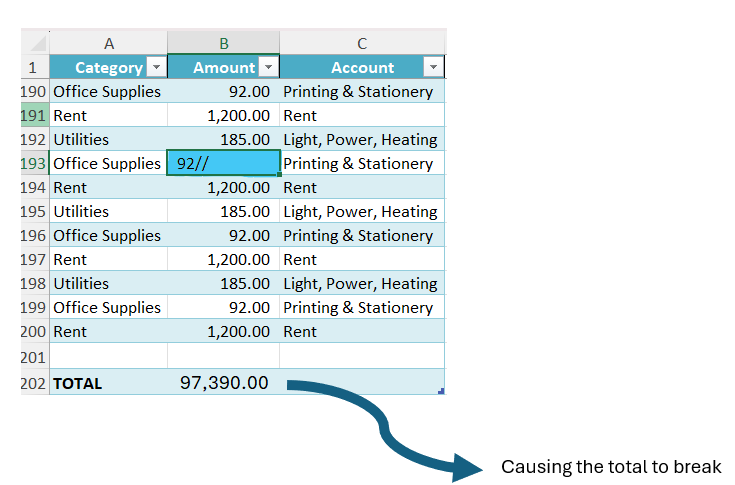
Everything you do is visible on the grid. If one cell breaks, everything around it gets affected.
Excel Case Scenario
An accountant needs to sum expenses in column B for a monthly report:
=SUM(B3:B200)
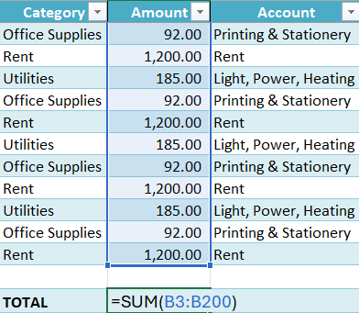
This works perfectly on one sheet.
But as soon as:
- new departments are added
- more months are added
- separate spreadsheets enter the picture
- data grows beyond a few thousand rows

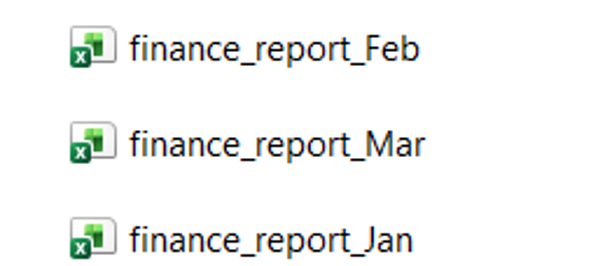
…the formulas begin to strain. You need helper columns, extra sheets, and manual updates. Excel becomes harder to manage, slower to use, and more prone to errors.
Excel is an excellent tool for personal analysis and modelling. However, its design isn’t meant for the kind of automated, large-scale reporting that businesses eventually require.
DAX: Context-Driven Modelling
DAX (Data Analysis Expressions) is the formula language behind Power BI, Analysis Services, and Power Pivot. Unlike Excel, DAX doesn’t care about cells at all.
Instead, DAX works across:
- tables
- relationships
- filters
- user interactions
It’s built for dynamic, model-driven reporting rather than static spreasheets.
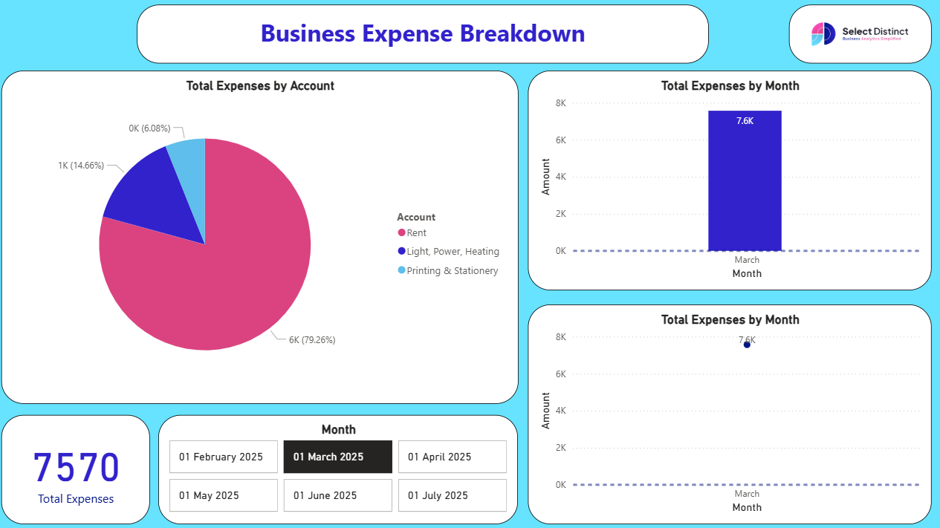
DAX responds to context — here, March 2025 has been selected
How DAX Works
DAX formulas operate inside a semantic data model.
Instead of pointing to cells, you work with:
- Tables (e.g., Expenses)
- Columns (e.g., Expenses[Amount])
- Measures (dynamic calculations)
- Row context & filter context (rules that define where and how a calculation is being evaluated)
This means DAX is constantly recalculating based on the context of the visual, filter, or user action.
DAX Case Scenario
A finance team wants to calculate total expenses by department and year in Power BI:
Total Expenses = SUM(Expenses[Amount])
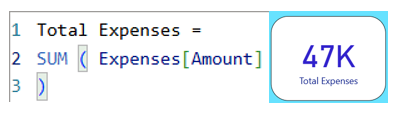
Unlike Excel, Power BI measures aren’t tied to fixed cells.
Your Total Expenses measure automatically changes when:
- A month button is selected → every visual updates to show that month’s spending.
- An account slice is clicked → the dashboard filters to show spending for that category.
- A point on the bar or line chart is selected → the other visuals adjust to that month’s context.
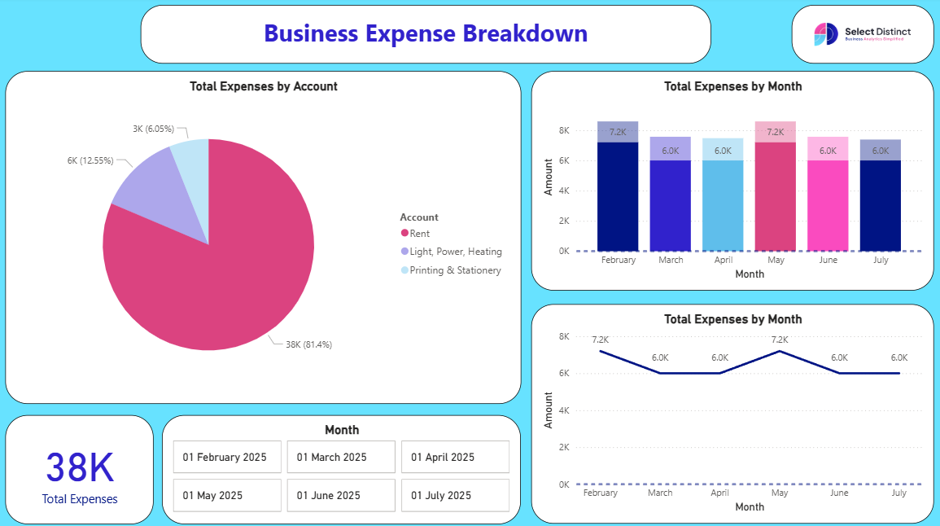
The same measure works everywhere — tables, charts, cards, and tooltips — without rewriting the formula.
DAX is more than just a formula language. It’s the engine that handles all your calculations automatically, no matter how you slice or filter the data.
What DAX Unlocks
With DAX, you can build:
✔ Interactive dashboards
✔ Automated refreshes
✔ Reusable measures
✔ Models that scale to millions of rows
✔ Analytics that adapt instantly to user selections
DAX turns your data into a dynamic, living story rather than a static collection of spreadsheets.
Excel vs DAX: Two Worlds, One Goal
Although both Excel and DAX aim to help you produce calculations and insights, they do it in fundamentally different ways.
Below is a clear side‑by‑side comparison:
| Feature | Excel Formulas (Cell-Based) | DAX (Context-Driven) |
| Calculation Logic | Cell-by-cell | Filter + Row context |
| Data Structure | Flat sheets | Relational data model |
| Performance | Slows with large datasets | Optimised for millions of rows |
| Iterators | Limited (arrays, helper columns) | Robust (SUMX, FILTER, etc.) |
| Measures vs Columns | No distinction | Measures (dynamic) vs Columns (stored) |
| Syntax | A1 references | Table[Column] syntax |
| Data Volume | Thousands of rows | Millions+ |
| Mindset | Manual cells | Model-driven context |
Summary
Excel = reactive, manual, cell-driven
DAX = proactive, dynamic, model-driven
Understanding this difference is the key to scaling your analytics.
Common Formula Translations
Here are some familiar Excel operations and their DAX equivalents:
| Task | Excel Formula | DAX Equivalent |
| Sum a column | =SUM(A1:A10) | SUM(Sales[Amount]) |
| Conditional sum | =SUMIF(range, criteria, sum_range) | CALCULATE(SUM(…), FILTER(…)) |
| Multiply then sum | =SUMPRODUCT(A:A, B:B) | SUMX(Table, Table[A] * Table[B]) |
| Lookup values | =XLOOKUP(…) | RELATED(…) or LOOKUPVALUE(…) |
These examples highlight that:
- Excel uses direct cell references,
- DAX uses table and column logic.
Once you stop thinking in cells, DAX becomes far easier.
Final Thought: Evolving From Formulas to Insight
Excel formulas are familiar, flexible, and deeply powerful. But they were never built for scalable, model-driven reporting across complex datasets.
DAX isn’t just a new syntax — it’s a new mindset.
One that:
- scales with your business
- adapts to your data
- responds to users
- creates clarity
- unlocks deeper insight
At Select Distinct, we help you make that shift — visually, intuitively, and with branded clarity. Whether you’re building dashboards for clients or streamlining your internal reporting, understanding the difference between Excel and DAX is the first step toward smarter, more scalable analytics.
Don’t have time to build and maintain complex dashboards?
Let Select Distinct turn your raw spreadsheets into automated, interactive Power BI reports that scale with your business.