Dashboard:
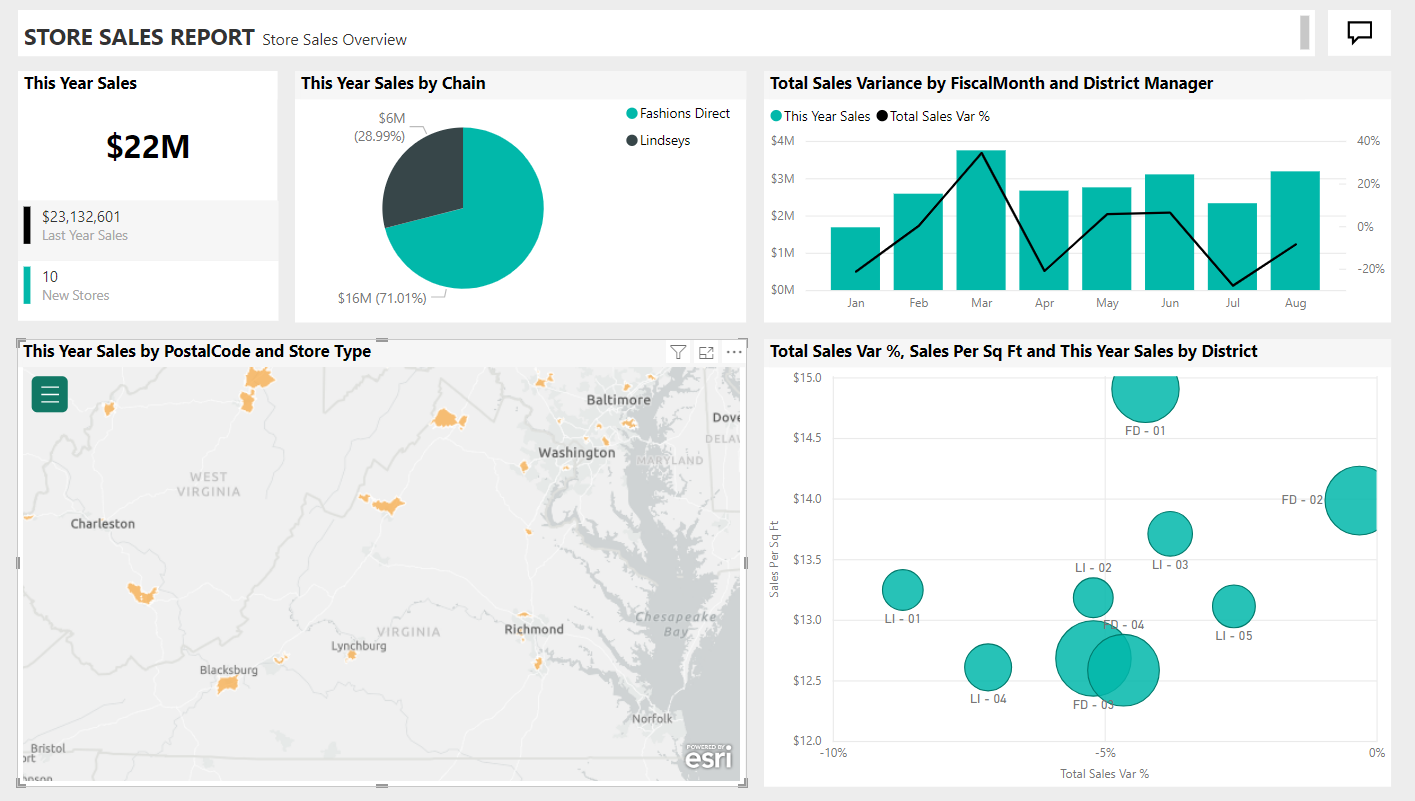
A single page that displays visualizations and KPIs. These can be used to combine different snippets of data from a range of reports into a single ‘executive’ view using tiles
Report:
A collection of visualizations like graphs, charts, tables, filters, and slicers. Reports are created using Power BI Desktop
Visualizations:
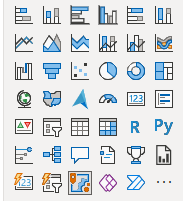
Graphical representations of data, in the form of charts, tables and more
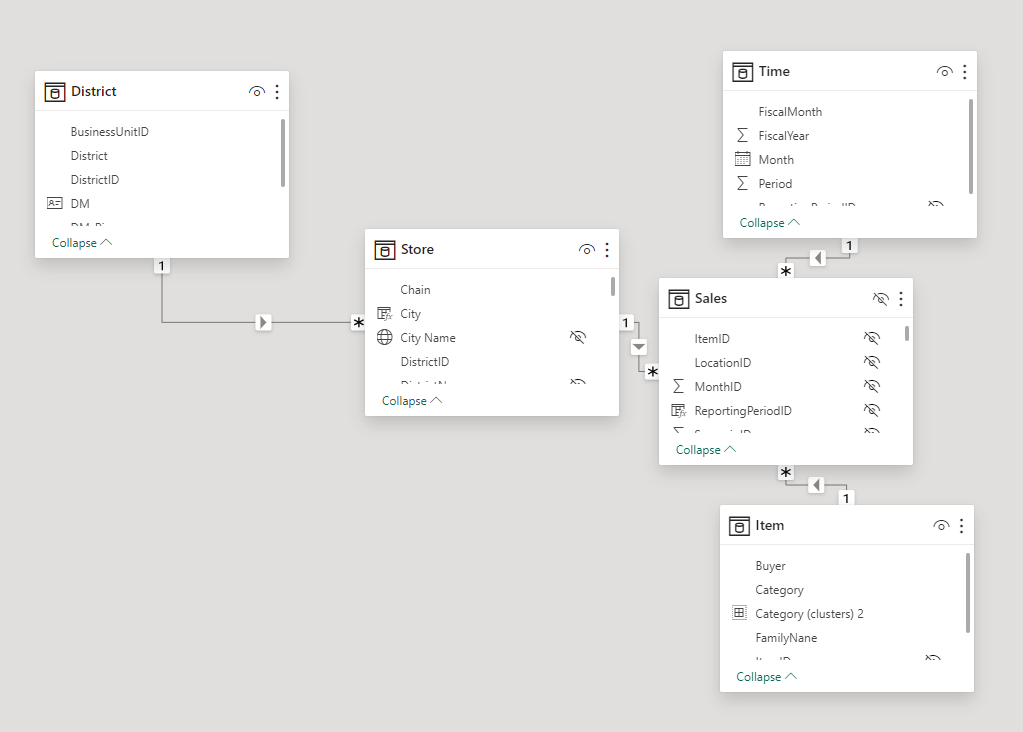
Data Model:
A collection of tables, columns, and relationships. Connecting the separate data sets together
Data Transformation:
The process of cleaning and transforming data according to the user’s needs. To get the data ready for reporting
Data Source:
A place where data is stored, such as a database, file, or web service.
Data Refresh:
The process of updating data in a report or dashboard.
Data Gateway:
A data gateway acts as a bridge between on‑premises data sources and Power BI.
Quick Insights:
A feature that automatically generates insights based on the data.
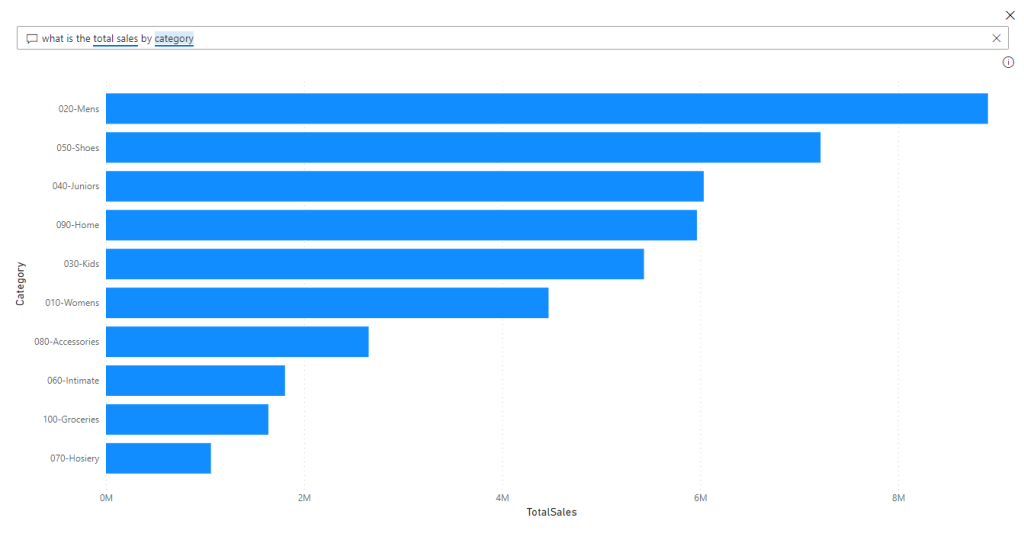
Natural Language Query:
A feature that allows users to ask questions about their data in natural language.

Here are some of the main concepts used in Power BI
Dashboard:
A single page that displays visualizations and KPIs. These can be used to combine different snippets of data from a range of reports into a single ‘executive’ view using tiles
Report:
A collection of visualizations like graphs, charts, tables, filters, and slicers. Reports are created using Power BI Desktop
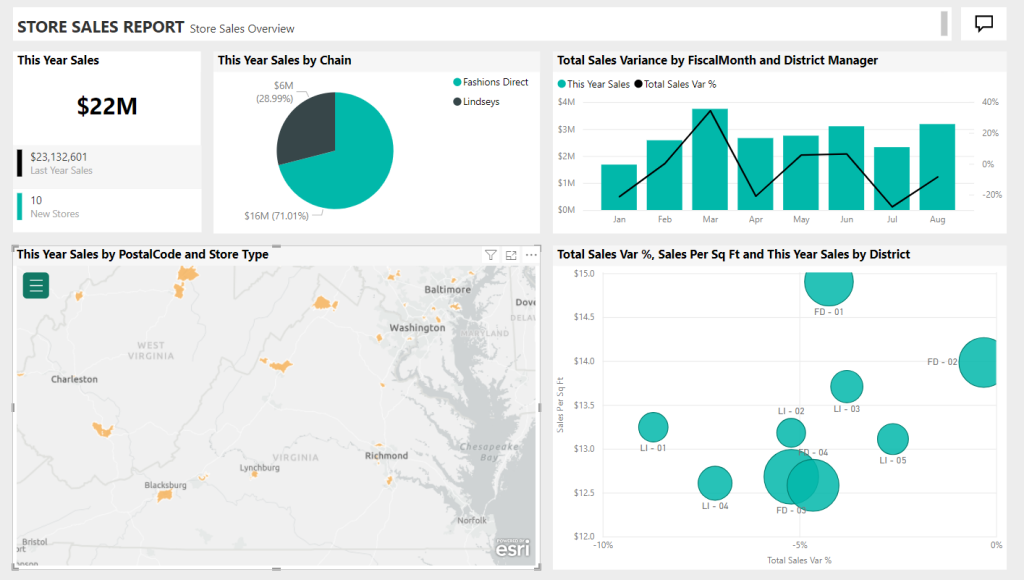
Visualizations:
Graphical representations of data, in the form of charts, tables and more
Data model:
A collection of tables, columns, and relationships. Connecting the separate data sets together
Data transformation:
The process of cleaning and transforming data according to the user’s needs. To get the data ready for reporting
Data source:
A place where data is stored, such as a database, file, or web service.
Data refresh:
The process of updating data in a report or dashboard.
Data gateway:
A bridge between on-premises data sources and Power BI.
Quick Insights:
A feature that automatically generates insights based on the data.
Natural Language Query:
A feature that allows users to ask questions about their data in natural language.