DAX Calculate Function: Best Practices and Alternatives
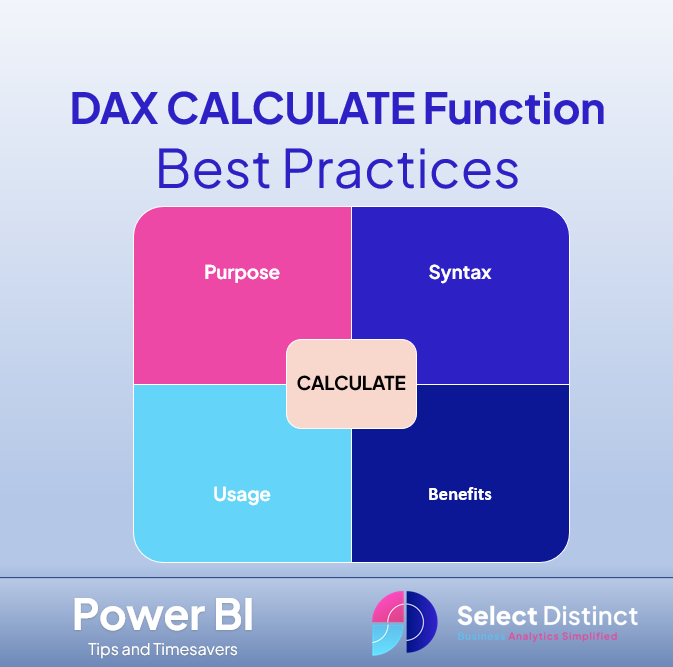
The DAX CALCULATE function is one of the most powerful tools within the Data Analysis Expressions (DAX) language. It is used in Power BI, SQL Server Analysis Services, and Excel PowerPivot. Understanding how to properly use CALCULATE is essential for creating dynamic and insightful reports. DAX (Data Analysis Expressions) is a formula language used in […]
Power BI Many to Many Relationships

Power BI modelling is central to any report. Following best practise using a star schema, and many to one relationships are not always possible. One of the more complex features available is the many-to-many relationship. These can both beneficial and tricky to manage. In this post, we’ll break down how many to many relationships work […]
Boost Your Power BI with Essential External Tools
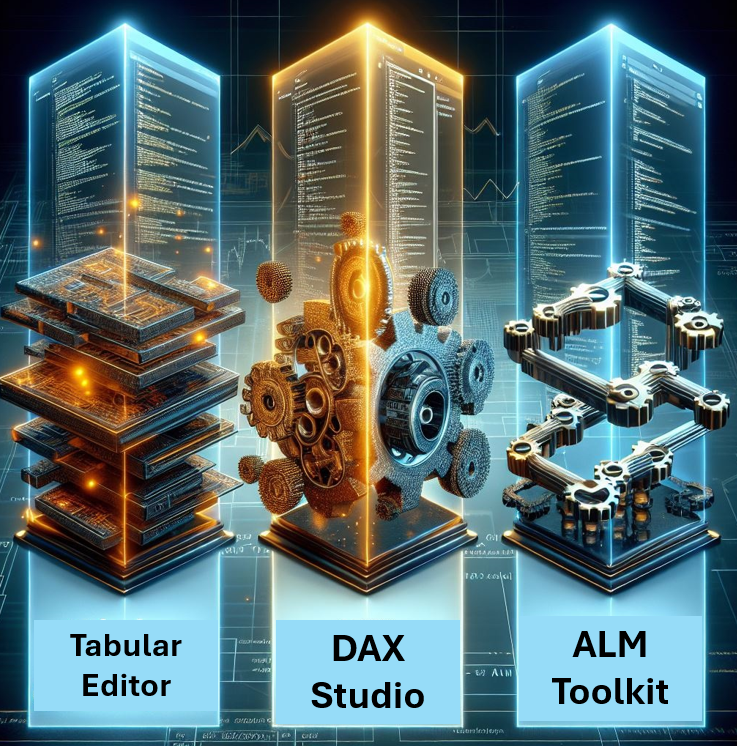
Power BI’s external tools work to enhance your development time. In this blog, we’ll look at some of the best external tools for Power BI and how they can enhance your data analysis and reporting. The tools are generally designed to review and optimise the performance of data models. These tools are great way to […]
DAX LOOKUPVALUE in Power BI
DAX LOOKUPVALUE function is the subject of this blog. It is particularly useful for retrieving values from tables based on specific conditions. In this blog, we will explore the LOOKUPVALUE function, its syntax and use cases. We will also cover examples to help you leverage its full potential. This is similar to the Power BI […]
Comparing Year on Year in Power BI
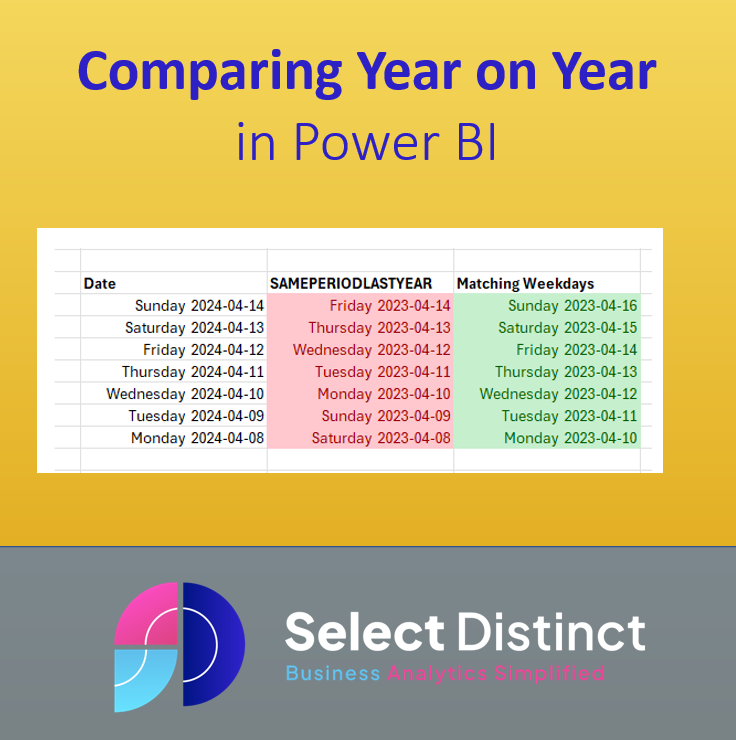
In an earlier post we showed you how to use SAMEPERIODLASTYEAR in power BI to compare data to the prior year The major shortfall of this is that the built in function matches the day of month and month, and does not properly reflect the day of the week If we show these with the […]
How to Sync Slicers in Power BI: Step-by-Step Guide
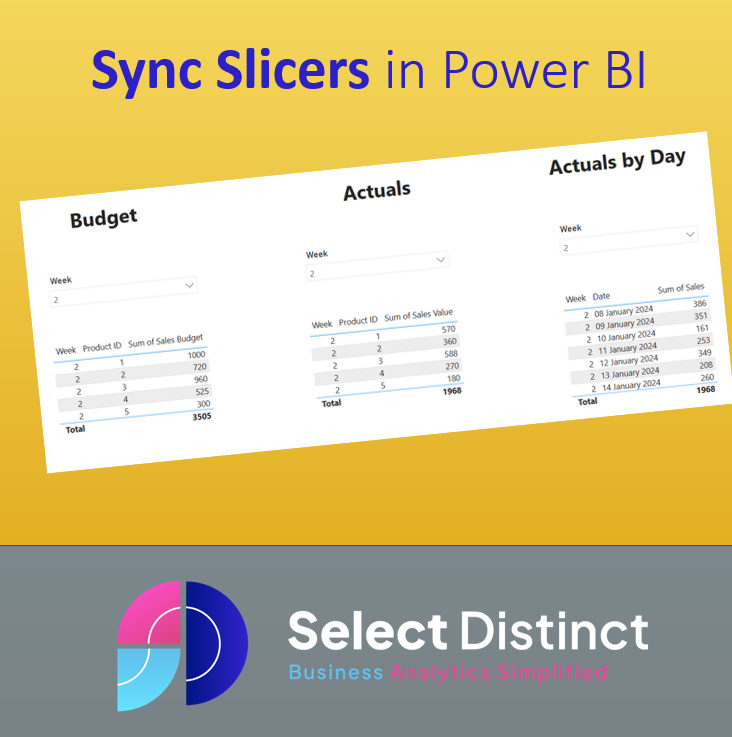
This post explains how to sync slicers in Power BI, without any complex code Slicers are an excellent way to give your users the ability to explore data, allowing users to use the slicers to filter the data down to particular information of interest. But, if your data has different data sets with common values […]
Calculated Columns and Measures in Power BI
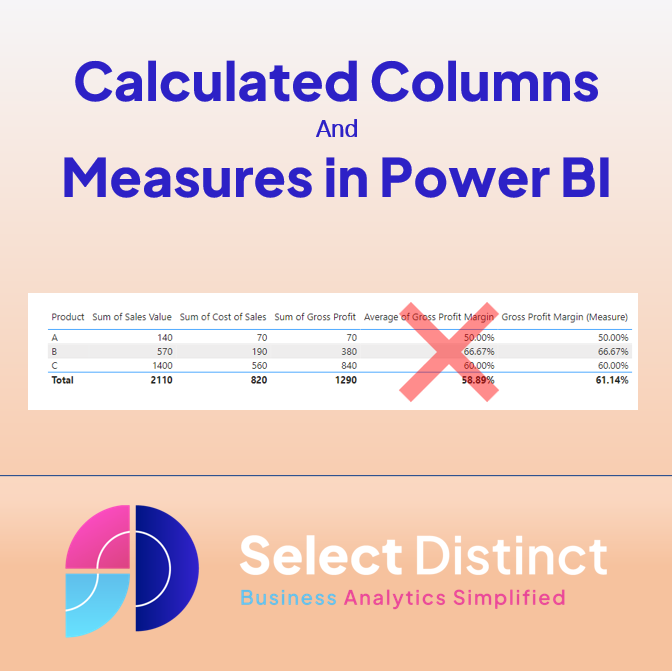
Introduction to Calculated Columns and Measures in Power BI A guide to understanding the differences between calculated columns and measures in DAX for Power BI What is a calculated column? A calculated column is a static value added to a table, calculated row by row when you load the data. What is a measure? A […]
When to transform data for Power BI
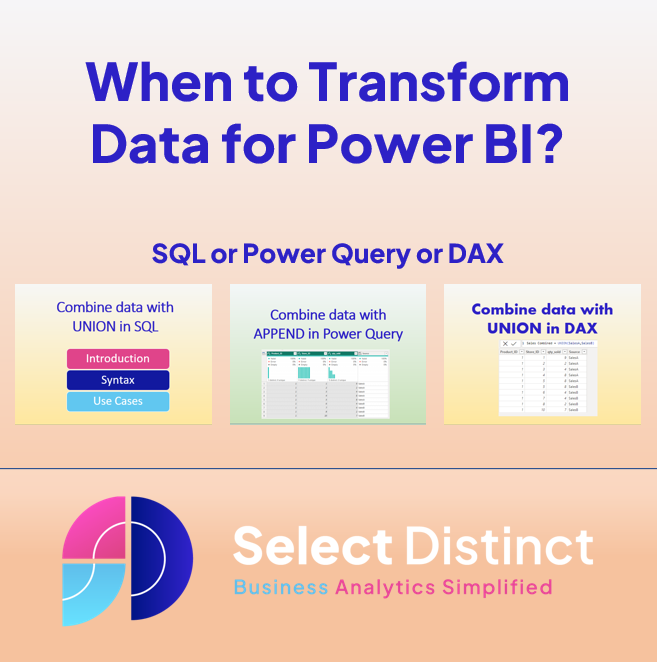
As a general principle we should always look to transform data close to its source to gain efficiencies and minimise potential for discrepancies Over the last few weeks we have shown how data can be combined from multiple sources in three different ways UNION in SQL APPEND data in Power Query UNION in DAX A […]
UNION in DAX
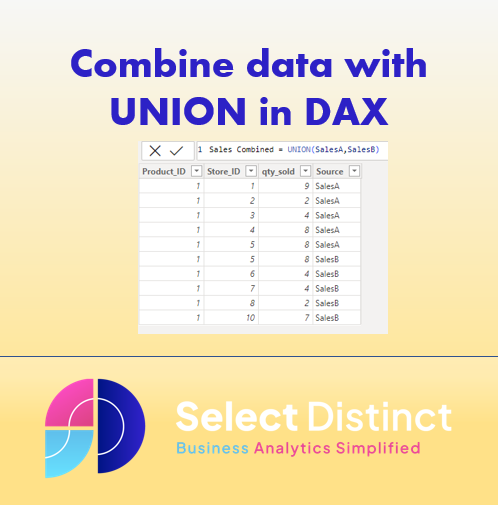
Using UNION in DAX is a third option to combine data for analysis in Power BI We recently showed how to do this in SQL UNION in SQL and how to do similar in Power Query APPEND in Power Query It isn’t always possible to do this in SQL such as if the datasets are […]
Advanced Top N Filter Power BI
The basic Top N filter in Power BI can be very useful. But if you need to show the values of the whole you will need to use an advanced Top N Filter Measure This guide shows you how you can set it up If you use the standard top N filter you would see […]