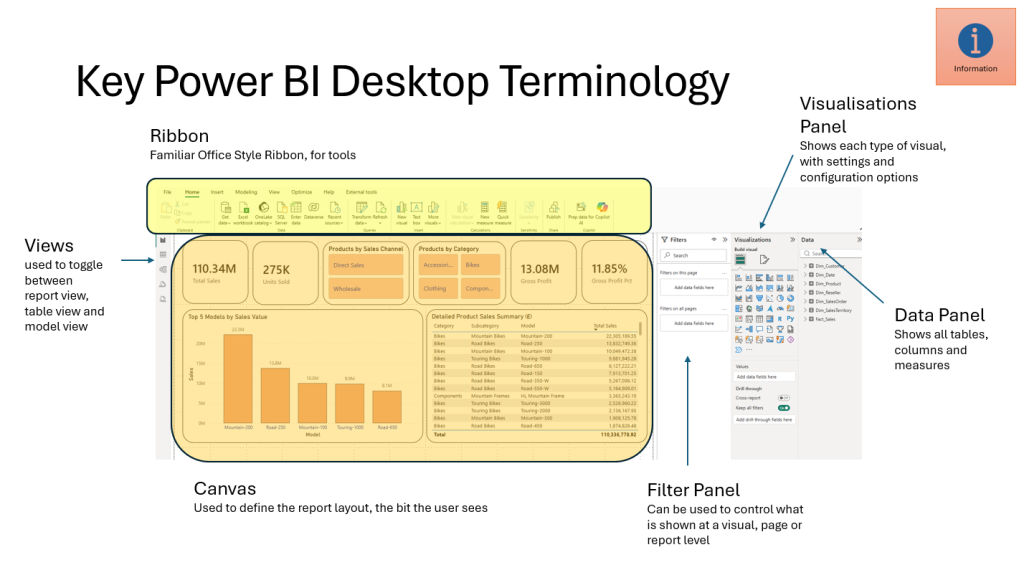
Power BI Glossary
Clear Definitions of Key Power BI Terms
Explore the Power BI glossary below. Each term is listed individually for easy reference and future expansion with examples or best practices.
Categories
1. Core Concepts
Power BI Desktop
A Windows application used to create data models, reports, and visualisations. It allows users to connect to data sources, transform data using Power Query, and build interactive reports using DAX and visuals. It’s the primary development environment for Power BI. Read more about Power BI
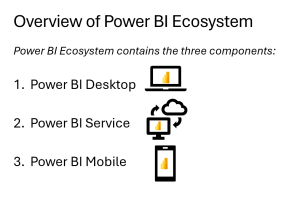
Power BI Service
A cloud-based platform (app.powerbi.com) where users publish, share, and collaborate on Power BI reports and dashboards. It supports features like scheduled refresh, sharing via workspaces, and deployment pipelines.Power BI Mobile
Mobile apps available for iOS and Android that allow users to view and interact with Power BI reports and dashboards on the go. It supports touch-friendly visuals and alerts.Dataset
A collection of data loaded into Power BI, either imported or connected via DirectQuery. Datasets serve as the foundation for building reports and can include tables, relationships, measures, and calculated columns.Report
An interactive canvas in Power BI that contains visuals, slicers, and filters based on a dataset. Reports can have multiple pages and are used to explore and present data insights.Dashboard
A single-page, consolidated view of visuals and KPIs, often pinned from multiple reports or datasets. Dashboards are only available in the Power BI Service and are used for monitoring and quick insights.Workspace
A container in the Power BI Service for organising related content—datasets, reports, dashboards, and dataflows. Workspaces support collaboration and access control and are essential for managing content in teams or departments.Dataflow
A cloud-based ETL (Extract, Transform, Load) tool within Power BI Service that allows users to create reusable data transformation pipelines using Power Query Online. Dataflows store data in Azure Data Lake and can be used across multiple datasets.Semantic Model
The structured representation of data in Power BI, including tables, relationships, measures, and metadata. It defines how data is understood and queried, enabling consistent reporting and analysis.Gateway
A bridge between on-premises data sources and the Power BI Service. It allows secure data refresh and live queries from cloud-hosted reports to local databases. There are two types: personal and enterprise gateways.2. Data Sources & Connectivity
DirectQuery
A data connectivity mode where Power BI queries the source database in real time without importing data. It allows up-to-date reporting but may impact performance depending on the source system.
Import Mode
The default mode in Power BI where data is loaded into the in-memory VertiPaq engine. It offers fast performance and full DAX capabilities but requires scheduled refreshes to stay current.
Live Connection
A mode used primarily with Analysis Services (SSAS or Azure AS), where Power BI connects directly to a semantic model without importing data. Modelling is done in the source, and Power BI acts as a visualisation layer.
Data Gateway
A bridge that enables secure data transfer between on-premises data sources and Power BI Service. It supports scheduled refreshes and live queries. Available in personal and enterprise modes.
OData Feed
A standardised protocol for querying and updating data via web services. Power BI can connect to OData endpoints to retrieve structured data from platforms like Dynamics 365 or SharePoint.
SQL Server
A widely used relational database system. Power BI can connect to SQL Server using Import or DirectQuery modes, enabling robust reporting from transactional or analytical databases.
Excel
A common data source for Power BI. Users can import tables, named ranges, or Power Query models from Excel files, making it ideal for quick prototyping or legacy data integration.
SharePoint
Power BI can connect to SharePoint lists or Excel files stored in SharePoint Online. It’s a popular source for collaborative data storage and document-based reporting.
Web Connector
Allows Power BI to retrieve data from public or authenticated web pages using HTML tables or APIs. Useful for scraping data or integrating with online services.
API Integration
Power BI can connect to REST APIs using custom connectors or the Web connector. This enables dynamic data retrieval from platforms like Salesforce, GitHub, or custom applications.
3. Data Modelling
Tables
Structured collections of data consisting of rows and columns. In Power BI, tables can be imported from data sources or created manually, and they form the foundation of the data model.
Relationships
Connections between tables that define how data is linked. Relationships are based on matching columns (keys) and enable filtering and aggregation across tables. They can be one-to-many, many-to-one, or one-to-one.
Cardinality
Describes the nature of relationships between tables—how many rows in one table relate to rows in another. Common types include: One-to-many (1:*), Many-to-one (*:1), Many-to-many (:).
Cross Filtering
Determines how filters flow between related tables in visuals and calculations. Power BI supports single-direction and bi-directional filtering, which affects how data is aggregated and displayed.
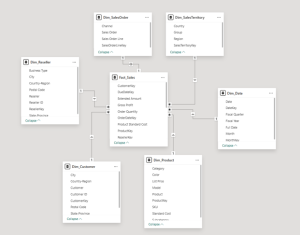
Star Schema
A data modelling approach where a central fact table is surrounded by dimension tables. It simplifies relationships and improves performance and clarity in reporting.
Snowflake Schema
An extension of the star schema where dimension tables are normalised into multiple related tables. While more complex, it can reduce data redundancy but may impact performance.
Calculated Column
A column created using DAX that performs row-level calculations. It’s stored in the data model and recalculated during data refresh.
Calculated Table
A table generated using DAX expressions, often used for intermediate calculations, filtering, or creating reference tables within the model.
Measures
Dynamic calculations created using DAX that aggregate data based on filter context. Measures are not stored in the model but are computed on the fly during report interaction.
DAX (Data Analysis Expressions)
A formula language used in Power BI for creating calculated columns, tables, and measures. DAX enables powerful data modelling and analytics through functions, operators, and context-aware logic.
4. DAX Core Functions
SUM
Aggregates values in a column by adding them together. Commonly used for totals in measures.
Example: SUM(Sales[Revenue])
CALCULATE
Modifies the filter context of a calculation. It’s one of the most powerful and essential DAX functions.
Example: CALCULATE(SUM(Sales[Revenue]), Region = “North”)
FILTER
Returns a table that represents a subset of another table, based on a condition. Often used inside CALCULATE.
Example: FILTER(Sales, Sales[Revenue] > 1000)
ALL
Removes filters from a column or table, often used to calculate totals or percentages.
Example: CALCULATE(SUM(Sales[Revenue]), ALL(Sales))
RELATED
Retrieves a value from a related table, based on relationships in the model.
Example: RELATED(Customer[Region])
VALUES
Returns a one-column table of unique values from a column. Useful for dynamic filtering and slicers.
Example: VALUES(Product[Category])
SWITCH
Evaluates an expression against multiple values and returns corresponding results. Similar to a case or if-else structure.
Example: SWITCH([Score], 1, “Poor”, 2, “Fair”, 3, “Good”, “Unknown”)
IF
Performs logical tests and returns different results based on true/false conditions.
Example: IF(Sales[Revenue] > 1000, “High”, “Low”)
RANKX
Ranks items in a table based on a given expression. Useful for leaderboards and performance comparisons.
Example: RANKX(ALL(Sales), SUM(Sales[Revenue]))
Time Intelligence Functions
Functions that enable calculations over time periods, such as year-to-date, previous periods, and rolling averages.
Examples: DATEADD(Date[Date], -1, MONTH) & DATESYTD(Date[Date])
5. Visualisation & User Experience (UX)
Visual Types
Power BI supports a wide range of visualisations, including bar charts, line charts, matrices, pie charts, scatter plots, maps, gauges, and more. Each visual type serves different analytical purposes and can be customised extensively.
Slicers
Interactive filters that allow users to select values and dynamically update visuals. Slicers can be single-select, multi-select, or
hierarchical, and are essential for user-driven exploration.
Filters (Visual, Page, Report)
Filters control which data is displayed: visual-level filters apply to a single chart, page-level filters affect all visuals on a report page, and report-level filters apply across all pages in a report.
Bookmarks
Capture the current state of a report page—including filters, slicers, and visuals—and allow users to return to that view. Useful for storytelling, navigation, and creating custom user experiences.
Drillthrough
Allows users to right-click on a visual and navigate to a detailed page filtered by the selected value. It enhances interactivity and supports deeper data exploration.
Tooltip
Displays additional information when hovering over a visual element. Tooltips can be customised to show extra data, visuals, or even entire report pages.
Conditional Formatting
Applies dynamic styling (colours, icons, data bars) to visuals based on values or rules. It helps highlight trends, outliers, and performance indicators.
Themes
Predefined or custom colour palettes and formatting styles that ensure visual consistency across reports. Themes can be imported or edited using JSON files.
Custom Visuals
Third-party or user-developed visuals that extend Power BI’s native capabilities. Available from the Microsoft AppSource or developed using the Power BI Developer Tools.
KPI Indicators
Special visuals designed to track key performance metrics against targets. They often include status indicators (e.g., traffic lights, arrows) to show progress or performance.
6. Performance Optimisation
Aggregations
Pre-calculated summaries of data that reduce the volume of information queried at runtime. Aggregations improve performance by allowing Power BI to use smaller, faster tables for common queries.
Query Folding
The process where Power BI pushes data transformations back to the source system (e.g., SQL Server) instead of processing them locally. This improves efficiency and reduces load on Power BI.
VertiPaq
The in-memory analytics engine used by Power BI to store and compress data. VertiPaq enables fast query performance by using columnar storage and advanced compression techniques.
Compression
Power BI uses columnar compression to reduce memory usage and improve performance. Efficient data types and reduced cardinality enhance compression ratios.
Incremental Refresh
A feature that allows Power BI to refresh only new or changed data instead of the entire dataset. It’s especially useful for large datasets and improves refresh times significantly.
Composite Models
Enable combining multiple data sources (e.g., Import and DirectQuery) within a single model. This allows flexibility in balancing performance and real-time access.
Optimisation Techniques
General strategies to improve performance, including reducing visual complexity, limiting the use of high-cardinality columns, using efficient DAX expressions, avoiding unnecessary calculated columns, and leveraging aggregations and indexing in source systems.
7. Sharing & Collaboration
Publish to Web
A feature that allows users to publicly share Power BI reports via a URL or embed code. It’s suitable for non-sensitive data and external audiences but should be used with caution due to lack of access control.
App Workspace
A collaborative space in the Power BI Service where teams can develop, manage, and share content. Workspaces support role-based access and are the foundation for deploying Power BI Apps.
Power BI Apps
Packaged collections of dashboards and reports published from a workspace. Apps provide a streamlined experience for end users and can be distributed across departments or organisations.
Row-Level Security (RLS)
A security feature that restricts data access based on user roles. RLS ensures that users only see data relevant to them, based on filters applied to the data model.
Deployment Pipelines
A tool for managing the lifecycle of Power BI content across development, test, and production environments. Pipelines support version control, change tracking, and automated deployment.
Data Certification
A process for marking datasets as trusted and endorsed within an organisation. Certified datasets promote reuse, consistency, and governance across reports and teams.
Usage Metrics
Built-in analytics that track how reports and dashboards are used. Metrics include views, shares, and user engagement, helping authors understand impact and optimise content.
8. Governance & Security
Sensitivity Labels
Metadata tags applied to Power BI content (reports,
dashboards, datasets) to classify and protect sensitive information. Integrated
with Microsoft Purview, these labels help enforce data protection policies
across the Microsoft ecosystem.
Data Loss Prevention (DLP)
Policies that monitor and restrict the sharing of sensitive
data in Power BI. DLP helps prevent accidental exposure of confidential
information by scanning content for predefined patterns or labels.
Audit Logs
Detailed records of user and system activities within Power
BI. Audit logs are available through Microsoft 365 compliance tools and help
organisations track access, changes, and sharing events for security and
compliance purposes.
Tenant Settings
Administrative controls that define how Power BI features
are used across an organisation. Tenant settings include options for sharing,
exporting, integration, and feature availability, and are managed in the Admin
Portal.
Admin Portal
The central interface for Power BI administrators to manage
users, workspaces, capacity, audit logs, and tenant settings. It provides
visibility into usage, performance, and governance across the Power BI
environment.
Licensing (Pro, Premium, PPU)
Defines access levels and capabilities in Power BI:
·
Pro: Required for sharing and collaboration.
·
Premium: Offers dedicated capacity, advanced
features, and enterprise-scale performance.
·
PPU (Premium Per User): Combines Pro features
with Premium capabilities for individual users.
9. Advanced Features
Paginated Reports
Reports designed for pixel-perfect formatting, ideal for printing or exporting to PDF. Built using Power BI Report Builder, paginated reports support complex layouts and are commonly used for financial statements and regulatory documents.
Power BI Embedded
A service that allows developers to integrate Power BI reports and dashboards into custom applications. It provides APIs and controls for embedding analytics into web portals, SaaS platforms, and internal tools.
XMLA Endpoints
Interfaces that allow external tools (like SQL Server Management Studio or Tabular Editor) to connect to Power BI datasets for advanced modelling, scripting, and automation. XMLA endpoints are available in Premium and PPU workspaces.
Python/R Integration
Power BI supports running Python and R scripts for data transformation and visualisation. This enables advanced analytics, machine learning, and statistical modelling directly within reports.
AI Visuals
Power BI includes built-in artificial intelligence visuals such as Decomposition Tree (breaks down metrics into contributing factors) and Q&A (allows users to ask natural language questions and get visual answers). These tools enhance data exploration and insight generation.
Goals (Scorecards)
A feature that enables tracking of business objectives and key results (OKRs) within Power BI. Goals are interactive, update automatically from data, and support status indicators and progress tracking.
Get Involved:
Suggest Terms & Request Clarification
Help Us Make the Glossary Even Better
We’re committed to keeping our glossary comprehensive and up to date, but we know there’s always room for improvement. If you’ve come across a term that’s missing or need further explanation on any topic, we’d love to hear from you.
Suggest a New Term
Have a technical phrase or concept you think should be added? Let us know! Your input helps us ensure the glossary remains useful to everyone in the community.
Request Clarification
If you find any definition unclear or would like more examples, feel free to request clarification. We aim to provide clear, practical insights for all users.
Share Your Feedback
- Email your suggestions directly
- Fill in our feedback form
Thank you for helping us build a better resource for everyone!
Power BI Consulting – Frequently Asked Questions
How do we get started?
We recommend starting with an initial FREE call to explore what the best options are for you. Rather than one solution fits all we like to learn about your needs and current capabilities and then work the best way for you
How long does it take?
Getting the best from your business intelligence should be part of your overall business strategy. We can help with reviewing your strategy through to implementation and training. From long term projects where me maintain regular touch points and help you on your journey, through to short specific projects we can support anything in between, from 5 days to 12 months +
Which data sources can you work with?
Anything from raw text files, spreadsheets, JSON through to SQL databases and on to integrations with back end systems using API connections
Although we often recommend setting up a central data warehouse to really bring your data together
Do you offer Power BI training?
Yes, We find that the best training is when the training material is using your company data as context is very important in business intelligence. We prefer to help you create tailored content for your users using your business data
From beginners through to more advanced techniques we have delivered training, but one of our more popular options is our Power BI mentoring where we have regular touch points that we help your users solve their reporting challenges with our remote support service
What size of project do you undertake?
From the simple, can you help with this dashboard? or teach us how to apply a specific technique through to a strategic review of your business reporting, we have the depth of knowledge to support you as you need. Variety in our service offering makes the projects enjoyable and varied
Other Power BI Resources
You can read all of our Power BI blog archives here