Mastering Excel LAMBDA Functions

Creating powerful, custom functions in Excel got easier with Excel LAMBDA functions. These functions offer a dynamic way to create reusable formulas. These can simplify complex calculations, tailor your data manipulation, and enhance the efficiency of your workflows. Here’s an in-depth look at how to use LAMBDA functions, including some practical examples. Excel LAMBDA functions […]
Import XML into Excel
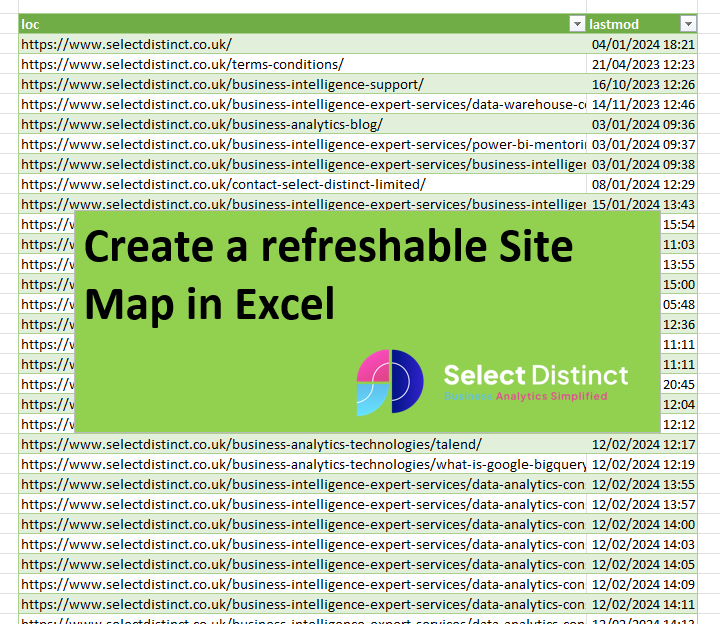
Importing XML data into Excel allows you to have a readily available data source that can be refreshed on Demand Once that data loaded into Excel you can use Excels features to explore, filter, sort or augment that data from other sources What is an XML file? An XML file is a plain text file […]
How to Create Drop Down Lists in Excel
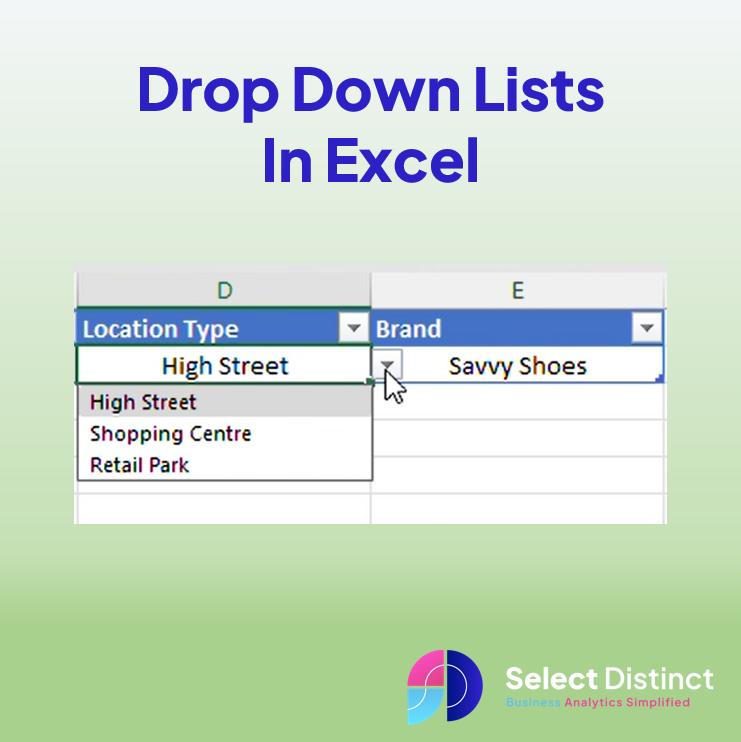
The Drop down list in Excel is a useful feature that allow users to select an item from a list of options. They are commonly used in data entry to control what data is entered. And to ensure that users do not enter incorrect data, preventing some errors This post shows you how to create […]
How to Append Data in Power Query: A Step-by-Step Guide
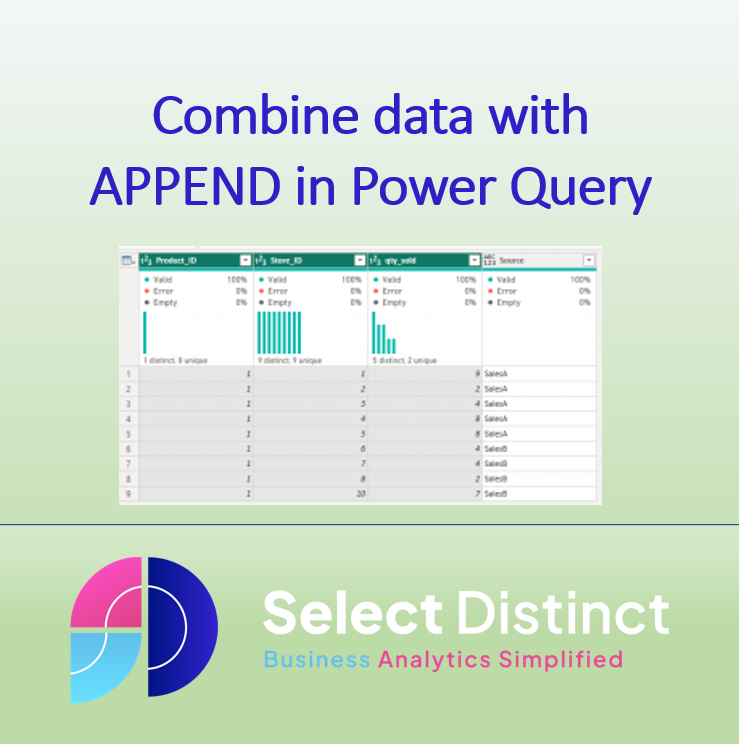
Last week we looked at how to combine datasets in SQL using UNION UNION in SQL – Select Distinct This week, we are looking at using the same source data, but doing the combining in Power Query, via the transform options in Power BI It is not always possible to combine the data in SQL, […]
How to use Format Painter in Excel
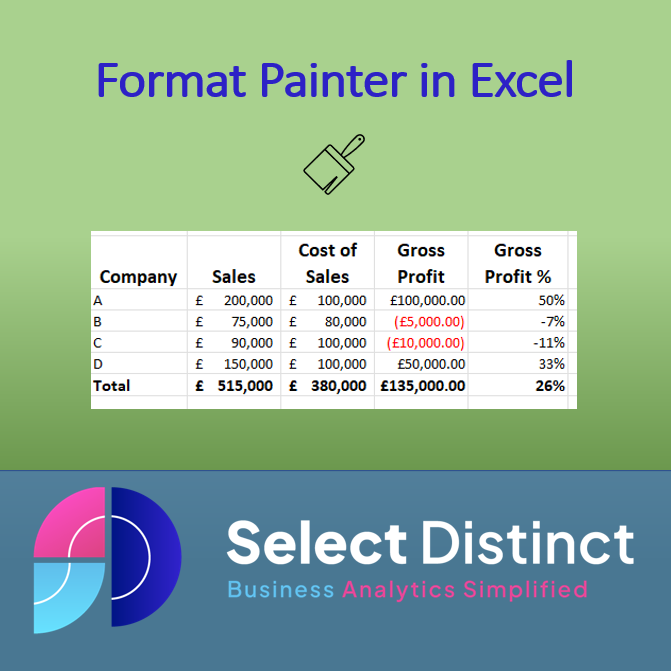
What is Format painter in Excel Format Painter is a tool in Excel that allows you to copy formatting from one cell or range of cells and apply it to another cell or range of cells. This can save you time when you want to apply the same formatting. For example, if you have a […]
How to use Transpose in Excel
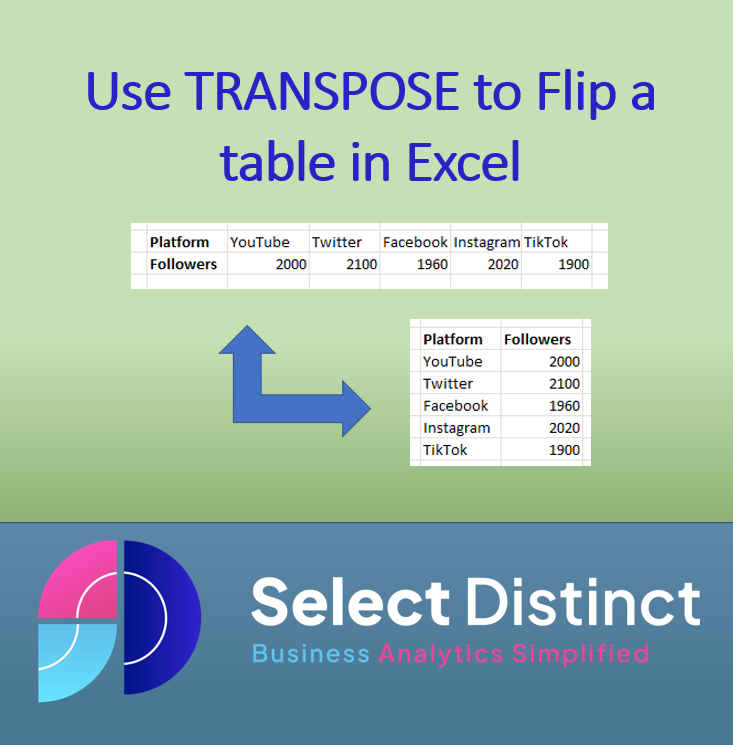
What is the TRANSPOSE function in Excel The TRANSPOSE function in Excel enables users to easily switch between vertical and horizontal ranges of cells. It is used to rearrange data so that it can be more efficiently read and analysed. With its versatility, the function assists with quickly converting two-dimensional cell ranges without having to […]
How to use Power Pivot in Excel
Part 2 – Excel Power Pivot How to use Power Pivot in Excel for data modelling and analysis This follows on from our previous post How to use Power Query What is Power Pivot in Excel Power Pivot is a cutting-edge data modelling technology, It empowers you to create data models, establish relationships, and perform […]
How to use Power Query
How to use Power Query and Power Pivot for data modelling and analysis Whilst Power BI is known for its advanced data modelling and ability to transform data. You may not know that many of these functions are available in Excel. These Blogs aim to give you the knowledge or skills to use these, namely […]
GETPIVOTDATA Function in Excel
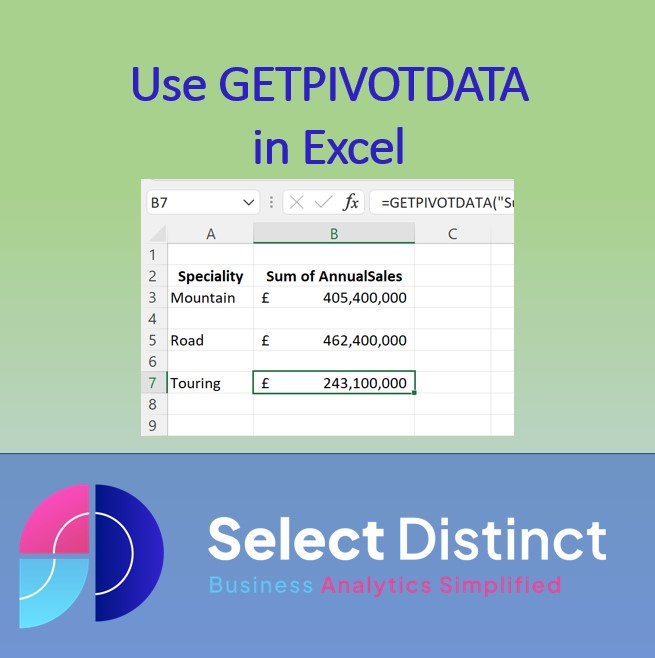
useUsing the GETPIVOTDATA Function in Excel to add flexibility to your Data Analysis & Reporting What is GETPIVOTDATA and How Can It Help You? The GetPivotData function in Excel provides users with the ability to return specific data points from a pivot table, Think of it like a specialised lookup mechanism that can find an […]
How to filter in Excel
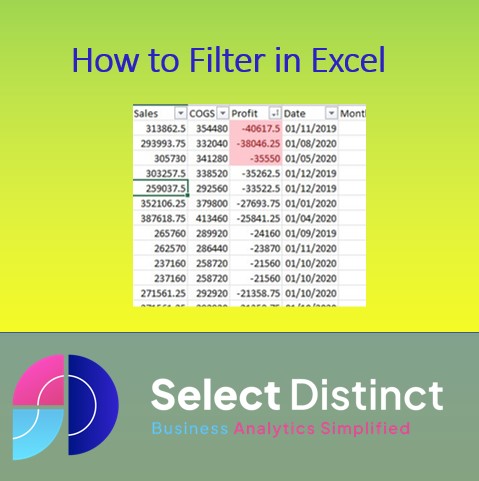
Filters are a powerful tool in Excel that can help you quickly organize and analyze large data sets. With filters, you can easily find the information you need without having to manually search through thousands of rows of data. In this blog post, we’ll discuss how to filter in Excel so that you can take […]