Retailers generate more data than ever before, but many still struggle to transform that data into actionable insight.
From sales transactions and inventory movements to customer behaviour and product performance, the challenge isn’t collecting data. It’s understanding what the data is telling you.
The most successful retailers use analytics dashboards to gain visibility across sales, stock, profitability and store performance. These dashboards help teams identify trends faster, make better decisions and respond quickly to changing market conditions.
In this guide, we’ll explore the five dashboards every retailer should have in place in 2026.
Why Retail Analytics Matters
Retail businesses face increasing pressure to:
- Reduce stockouts
- Optimise inventory levels
- Improve profitability
- Understand customer behaviour
- Increase operational efficiency
Without reliable reporting and visibility, decision-making often relies on intuition rather than evidence.
Retail analytics transforms raw data into clear, actionable insights, helping businesses improve performance across every area of their operation.
Dashboard 1: Executive Retail Performance Dashboard
Purpose
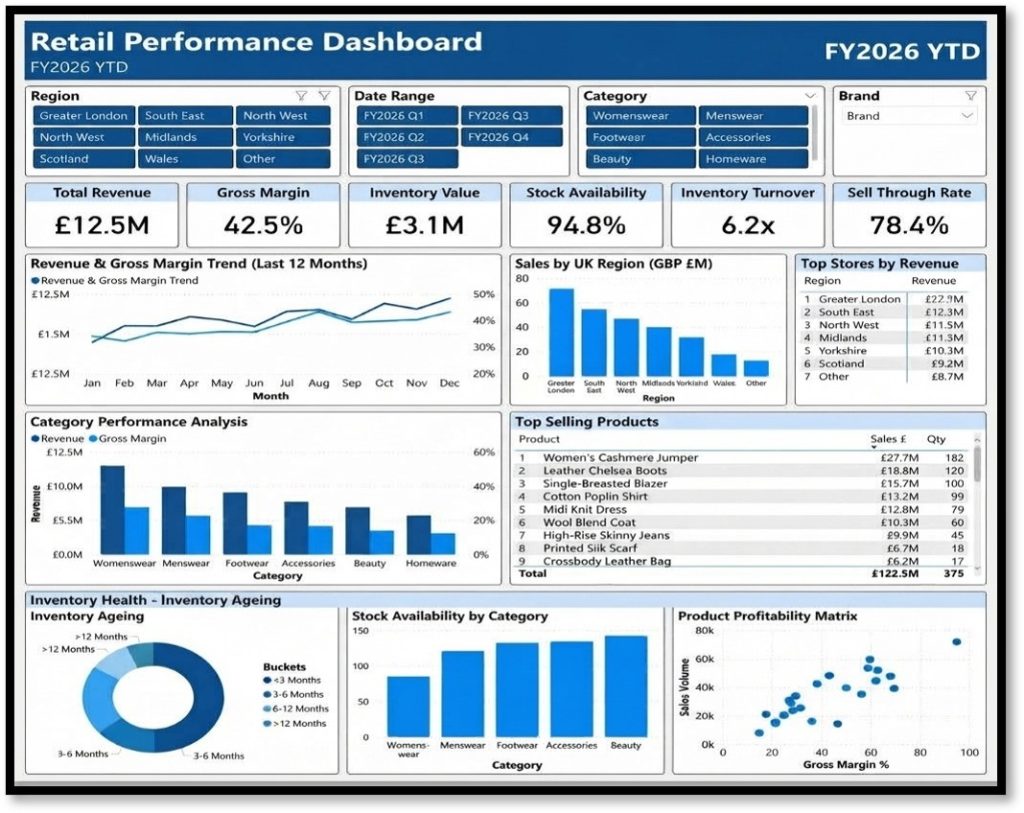
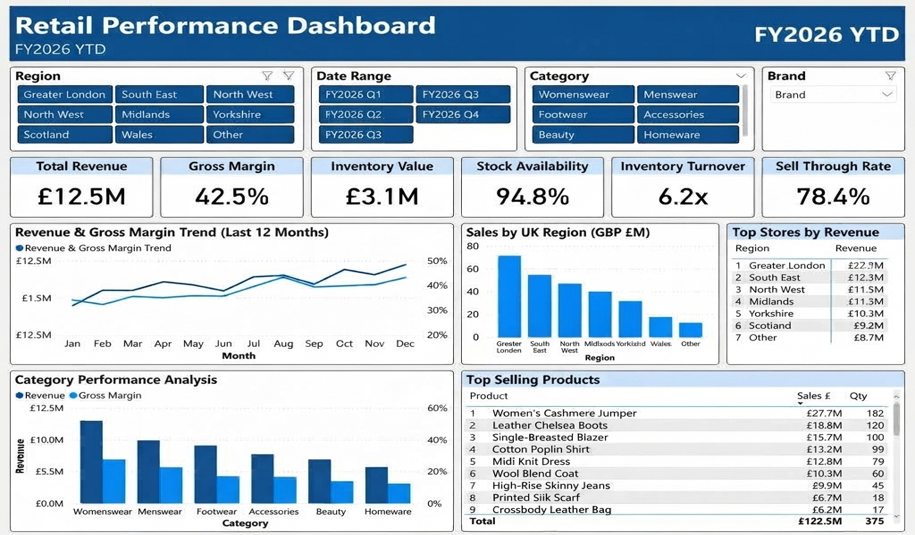
Provides a single view of overall business performance.
Key Metrics
- Revenue
- Gross Margin %
- Sales vs Target
- Average Transaction Value
- Store Performance
- Like-for-Like Sales Growth
Why It Matters
Senior leaders need immediate visibility into performance. Executive dashboards provide a clear overview of sales, profitability and operational health.
Dashboard 2: Inventory Management Dashboard
Purpose
Maintain optimal stock levels while reducing excess inventory.
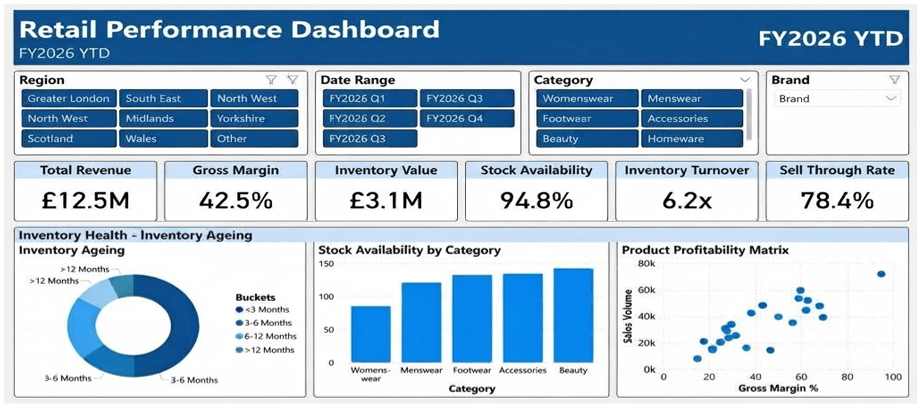
Key Metrics
- Stock Availability %
- Inventory Value
- Inventory Turnover
- Sell-Through Rate
- Aged Inventory
- Stockout Analysis
Why It Matters
Poor inventory visibility can result in lost sales, increased costs and reduced profitability.
Retail analytics helps identify inventory risks before they become business problems.
Dashboard 3: Product & Category Performance Dashboard
Purpose
Understand what drives revenue and profit.
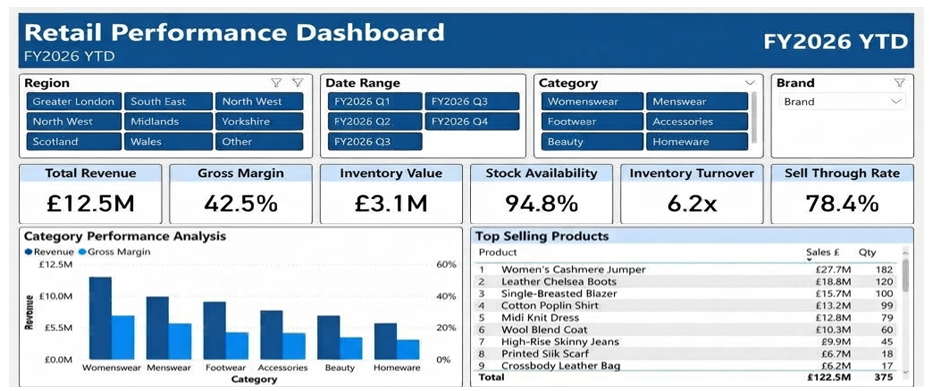
Key Metrics
- Sales by Category
- Margin by Product
- Top Selling Products
- Underperforming Products
- Product Lifecycle Performance
- Category Growth Trends
Why It Matters
Not all revenue is equal.
Product and category analytics help retailers focus on the ranges that generate the greatest value.
Dashboard 4: Customer Analytics Dashboard
Purpose
Understand customer behaviour and buying habits.
Key Metrics
- Repeat Purchase Rate
- Customer Lifetime Value
- Basket Value
- Purchase Frequency
- Customer Segmentation
- Retention Metrics
Why It Matters
Retailers that understand their customers can create more relevant offers, improve loyalty and increase revenue.
Dashboard 5: Store Performance Dashboard
Purpose
Compare performance across locations.
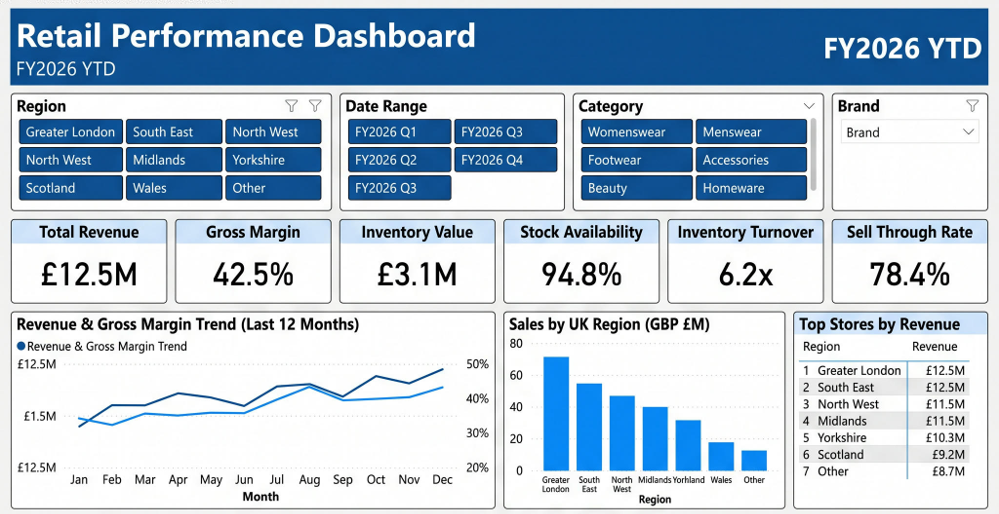
Key Metrics
- Sales by Store
- Margin by Store
- Labour Cost %
- Traffic vs Conversion
- Stock Availability
- Regional Performance
Why It Matters
Store-level analytics helps identify high-performing locations while highlighting areas requiring additional support.
Questions Every Retailer Should Be Asking
| Can You Answer: |
| Which products generate the highest profit? |
| Which stores are underperforming? |
| Where are stock shortages affecting sales? |
| What inventory is slow-moving? |
| Which categories are driving growth? |
| Are sales and margin tracking to target? |
If answering these questions requires multiple spreadsheets or manual reporting, there may be an opportunity to improve visibility through retail analytics.
How Retail Analytics Helps Retailers Make Better Decisions
The value of retail analytics isn’t in the data itself.
It’s in the decisions that data enables.
With the right dashboards and reporting framework, retailers can:
- Improve inventory visibility
- Reduce stockouts
- Identify profitable products
- Improve forecasting accuracy
- Monitor store performance
- Increase profitability
- Support data-driven decision-making
Download the Free Retail Analytics Guide
Understanding which dashboards you need is only the first step.
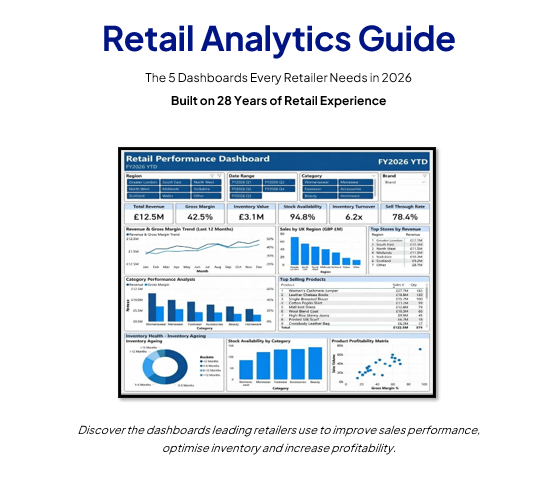
Our free guide, Retail Analytics: The 5 Dashboards Every Retailer Should Have in 2026, provides a practical framework for improving visibility across sales, inventory, profitability and store performance.
Inside you’ll discover:
- Essential retail dashboards
- Key retail KPIs
- Dashboard examples
- Retail analytics maturity assessment
- Proven reporting framework