

From Static Excel Sheets to Dynamic KPIs
Designing a Better Power BI Dashboard
If you’ve ever tried building operational KPI cards in Power BI from a wide, flat Excel sheet, you know how frustrating it can get. When your data is locked into static columns, filtering and displaying metrics neatly becomes a chore.

By reshaping your data into dedicated KPI and milestone tables, you can unlock much smoother dashboard designs.
Here is how we set up my project pipeline model from scratch using a 1,000-row project dataset.
Step 1: Loading the Raw Data
Before doing any modelling or shaping, you first need to bring your raw data into Power BI.
1. Open Power BI Desktop and click Get Data (or Excel workbook from the Home ribbon)
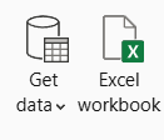
2. Select your project spreadsheet (in this case, our 1000-row project dataset) and load the main table.
We have named the table Projects in Power BI

Step 2: Setting Up the Date Dimension
Before touching any visuals, you need a proper calendar table, so your timeline slicers and monthly trend charts sync up correctly.
We generated a dynamic calendar using DAX based on the earliest enquiry and latest completion dates in the dataset:
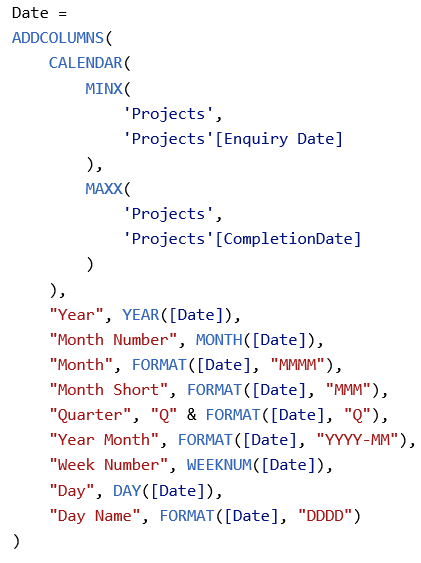
Code Snippet
Date =
ADDCOLUMNS(
    CALENDAR(
        MINX(
            'Projects',
            'Projects'[Enquiry Date]
        ),
        MAXX(
            'Projects',
            'Projects'[CompletionDate]
        )
    ),
    "Year", YEAR([Date]),
    "Month Number", MONTH([Date]),
    "Month", FORMAT([Date], "MMMM"),
    "Month Short", FORMAT([Date], "MMM"),
    "Quarter", "Q" & FORMAT([Date], "Q"),
    "Year Month", FORMAT([Date], "YYYY-MM"),
    "Week Number", WEEKNUM([Date]),
    "Day", DAY([Date]),
    "Day Name", FORMAT([Date], "DDDD")
)
Step 3: Creating the KPI Table in Power Query
To easily power individual KPI cards; like average project days or enquiry to survey turnaround times – unpivoting your metrics in Power Query is a gamechanger.
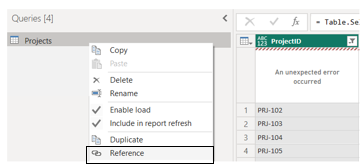
1. Reference the Source: Open Power Query, right-click your main project query. Select the ProjectID column
2.Isolate the Metrics: Keep your ProjectID and your key operational duration columns, then remove everything else.
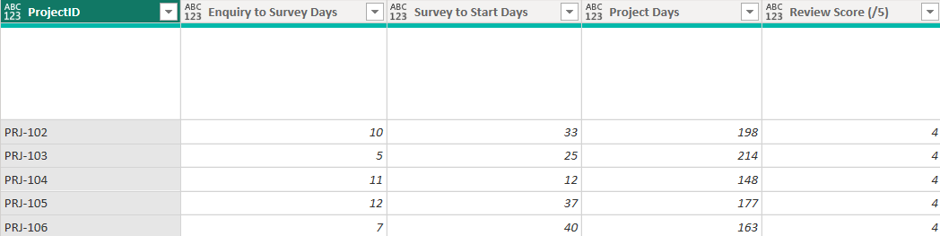
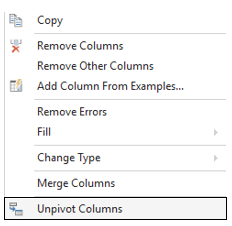
3.Unpivot: Select your metric columns, head over to the Transform tab, and click Unpivot Columns.
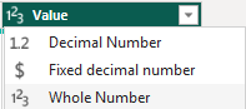
4.Clean Up: Filter out any blank values, and set the data type for the Value column to a Whole Number (or decimal if you need precision).
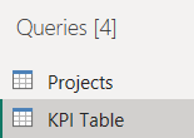
5.Name It: Call this query KPI Table
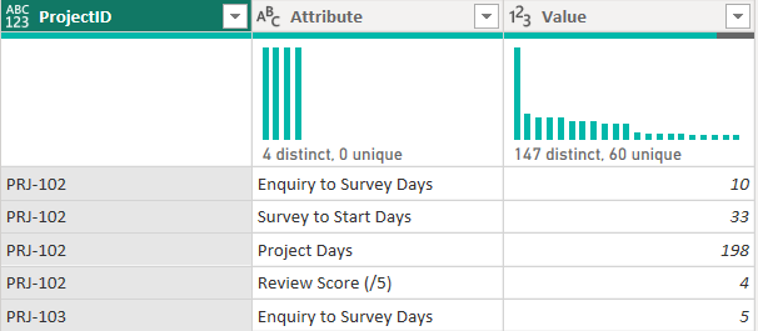
Our table now looks like above.
Step 4: Setting Up the Project Milestones Table
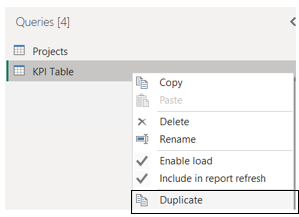
To track dates independently without messing up your day-count KPIs, you can duplicate that table for your milestones.
1.Duplicate: Right-click your KPI Table query and select Duplicate
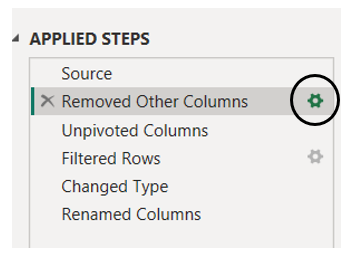
2.Adjust the Steps: Click the gear icon next to the Removed Other Columns step
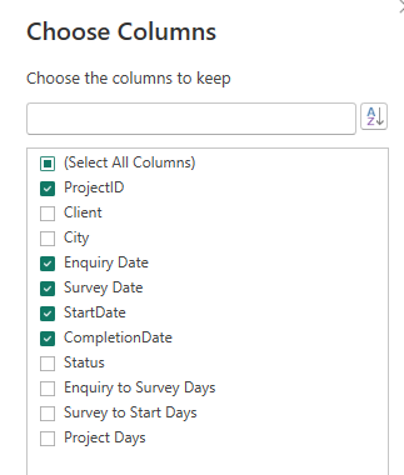
3.Swap the Columns: Untick the day-count attributes and select your date columns instead (Enquiry Date, Survey Date, Start Date, and Completion Date)
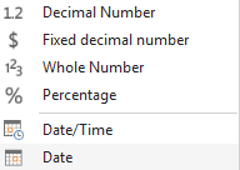
4.Format Dates: Unpivot those date columns and ensure the resulting Value column is set to a Date data type
5.Name It: Label this query Project Milestones
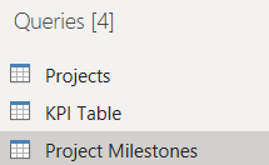
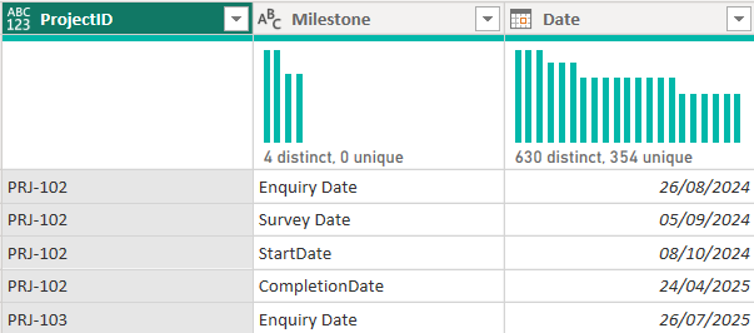
The table should now look like above.
Step 5: Enter KPI Target Data
Finally, we need to add the KPI targets into Power BI.
Navigate: Enter Data
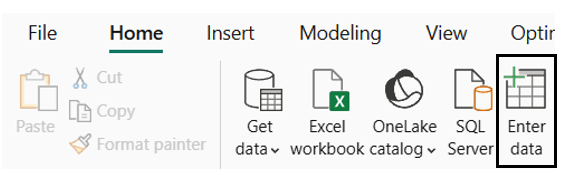
Enter the target data and name this KPI Targets
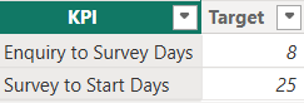
Step 6: Creating Model Relationships
Once all 5 tables are loaded and shaped in Power BI, you need to connect them in the Model View to establish the correct filters and context:
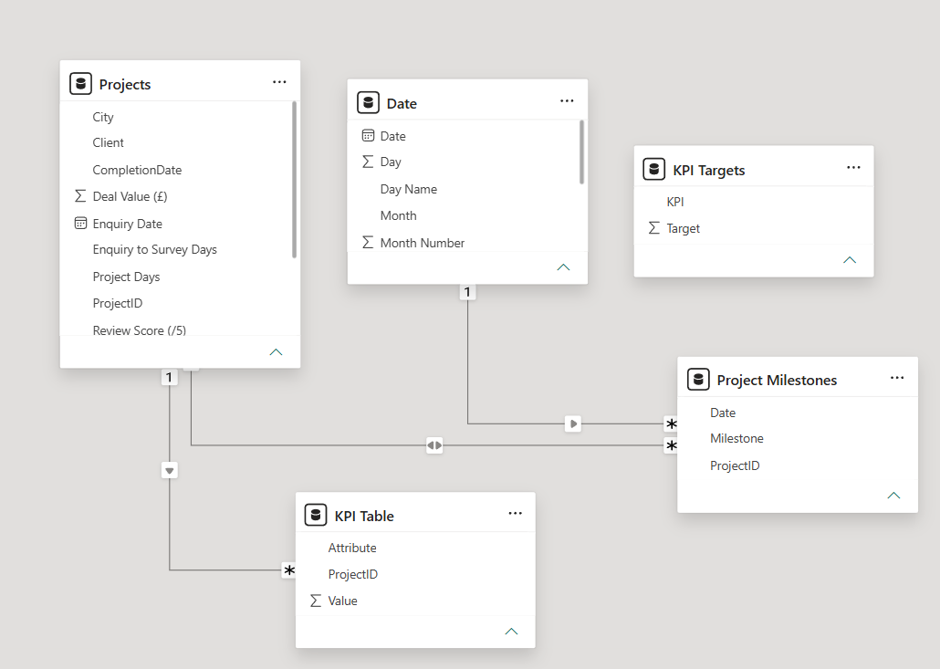
Link Projects to Supporting Tables: Drag and drop the ProjectID from your master Projects table down to create a one-to-many (1-*) relationship with both the KPI Table and Project Milestones table.
Connect the Calendar Dimension: Drag the Date field from your master Date table to tie it into your date attributes (such as connecting it to your milestone dates or primary project dates) to ensure cross-filtering across timelines.
Verify Table Layout: Ensure your unpivoted attribute tables and static target lookup tables link up cleanly without creating ambiguous paths, resulting in a cohesive, star-schema style layout.
The Finished Data Model
Once everything is wired up, your Power BI model should consist of 5 clean tables:
Date: Master calendar table linked to date fields
KPI Table: Unpivoted attribute-value table for high-level metrics
KPI Targets: Manually entered table for specific metric targets
Project Milestones: Unpivoted date-attribute table for tracking
Projects: Primary transactional dataset loaded straight from Excel
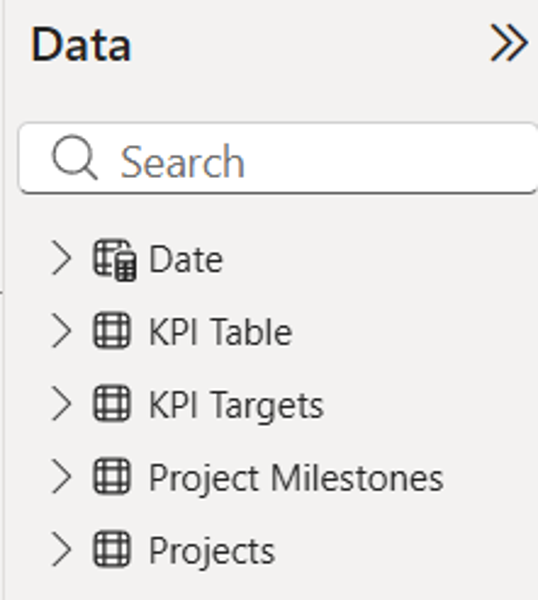
Structuring your data this way makes building custom card visuals, regional maps, and chronological trend lines easier!
Bringing It All Together
Demonstrating Dashboarding with Business KPIs
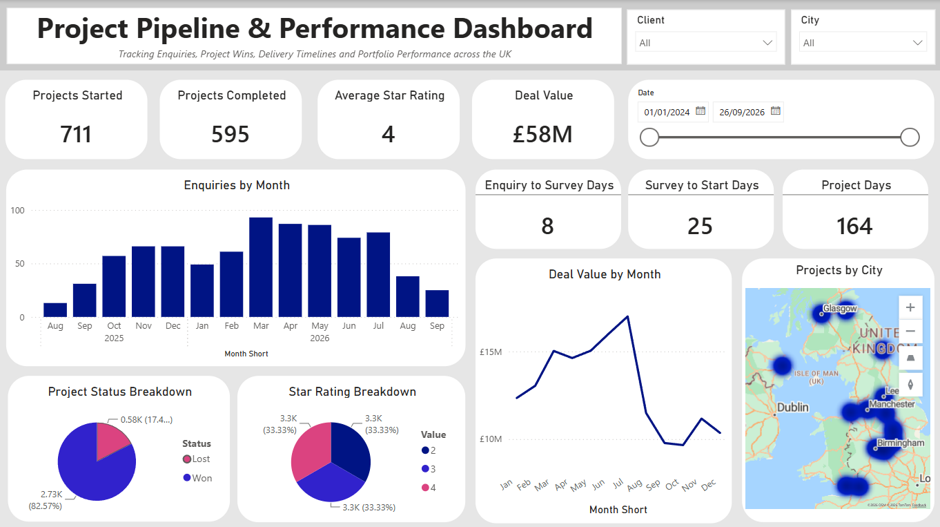
Once your 5-table data model is established and properly related, you can leverage it to build a comprehensive dashboard showcasing your core business KPIs and operational metrics in action, just like the Project Pipeline & Performance Dashboard shown below:
How It All Works Together
1.Executive Summary Cards: Instant visibility into metrics like:
Projects Started (711), Projects Completed (595), Average Star Rating (4), and total Deal Value (£58M).

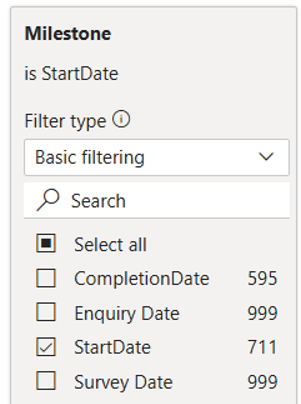
With help from the Project Milestone table, some of these cards can be a case of counting the Project IDs based on filtering the specific Milestone.
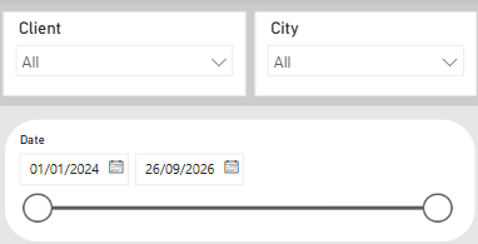
2.Global Filtering: Clean Client and City dropdown slicers alongside a dynamic date slider that slice the entire page simultaneously.
3.Operational Turnaround KPIs: Clear display of metrics driven directly from the unpivoted KPI Table, including:
Enquiry to Survey Days (8), Survey to Start Days (25), and Project Days (164)

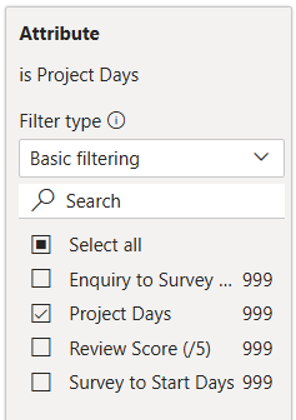
With help from the KPI table, these cards can be created by filtering the Attribute and taking the average of the Value
4.Trends and Spatial Mapping: You can easily use line charts driven by your calendar table, evaluate performance distributions via status and rating breakdown pie charts, or map out project concentrations across the UK using geographic map visuals.
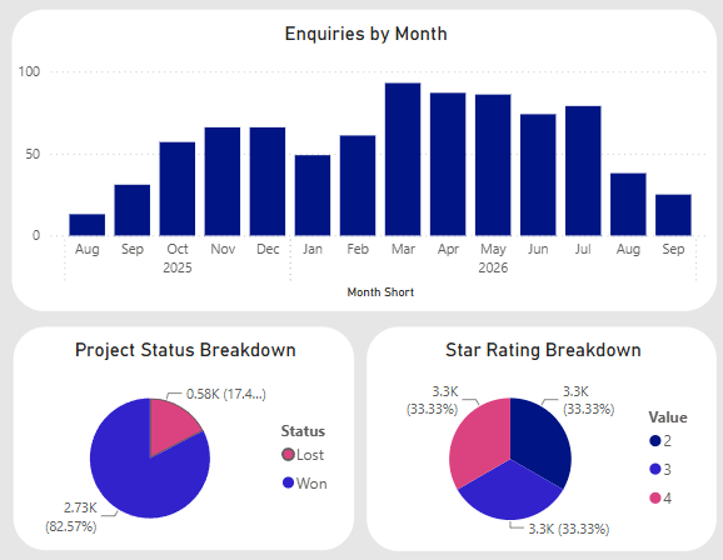
By stepping away from wide, flat sheets and moving toward unpivoted attribute tables and proper dimensional modelling, your Power BI reports transform from static spreadsheets into dynamic, scalable reporting solutions.
To make the most of this architecture, it is essential to tailor your KPIs directly to your unique business operations. Every industry and pipeline has distinct drivers.