
Building Reusable Date Logic for Semantic Models
One of the biggest challenges in Power BI is building flexible time intelligence that works across multiple reports without duplicating DAX.
Business users often want to analyse performance in different ways:
- Year-to-Date
- Previous Year
- Previous Quarter
- Previous Month
- Rolling 12 Months
- A specific reporting month
- Like-for-like trading day comparisons
Rather than creating separate measures for each scenario, we can build a reusable time intelligence framework directly into a Power BI semantic model.
In this guide, we’ll build a framework that includes:
- A Reporting Period selector
- A Month selector
- A Comparison selector
- A Comparison Basis selector
- Dynamic reporting period calculations
- Dynamic comparison period calculations
- Like For Like Day analysis
- Reusable reporting date ranges
- Centralised time intelligence logic
Once built, the framework can be referenced by any KPI in the model, providing consistent and reusable time intelligence across reports.
How the Framework Works
Before jumping into the DAX, it’s worth understanding the architecture.
The framework uses four disconnected selector tables:
Before jumping into the DAX, it’s worth understanding the architecture.
The framework uses four disconnected selector tables:
| Selector | Purpose |
| Reporting Period | Controls the date range being analysed |
| Month | Allows users to select a specific month |
| Comparison | Controls what the reporting period is compared to |
| Comparison Basis | Determines whether comparisons use Calendar Days or Like For Like Days |
These tables do not directly filter data.
Instead, they drive a series of DAX measures that dynamically calculate:
- Reporting Period Start Date
- Reporting Period End Date
- Comparison Period Start Date
- Comparison Period End Date
Those dates can then be reused across KPI measures, ensuring consistent time intelligence logic across every report and dashboard.
What the Finished Solution Looks Like
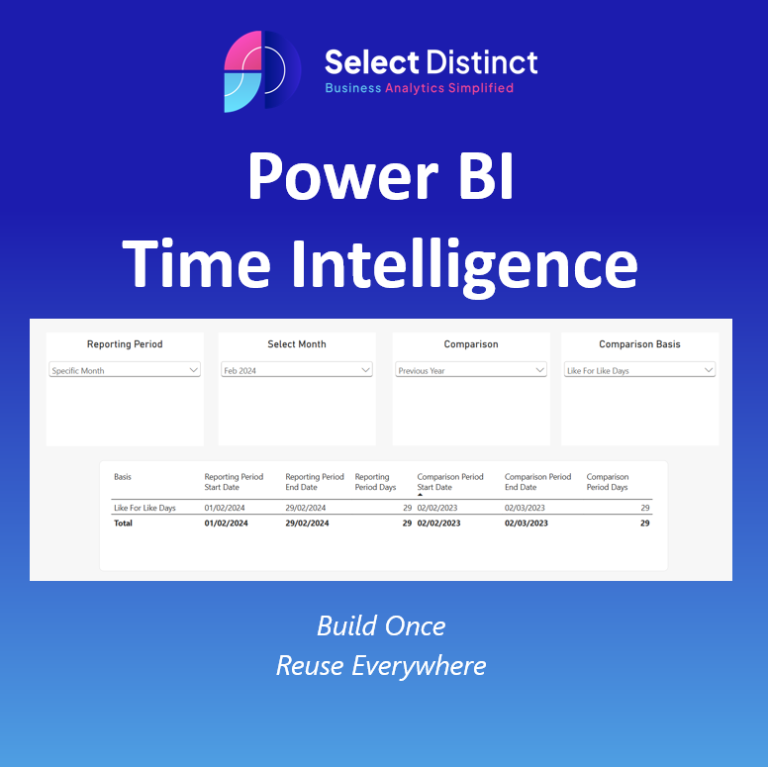
In the example below, the user has selected:
| Setting | Selection |
| Reporting Period | Specific Month |
| Month | February 2024 |
| Comparison | Previous Year |
| Comparison Basis | Like For Like Days |
The framework automatically returns:
| Measure | Value |
| Reporting Period Start Date | 01/02/2024 |
| Reporting Period End Date | 29/02/2024 |
| Reporting Period Days | 29 |
| Comparison Period Start Date | 02/02/2023 |
| Comparison Period End Date | 02/03/2023 |
| Comparison Period Days | 29 |
Because both periods contain 29 days, the comparison is more meaningful than a simple February 2024 versus February 2023 comparison.
With the framework established, let’s build it step-by-step.
Step 1: Create the Calendar Table
Every part of the framework relies on a properly structured calendar table.
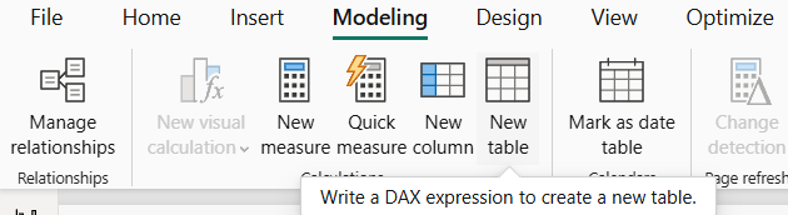
1. Create a new table:
Modelling → New Table
2. Paste the following DAX:

Calendar =
VAR StartDate = DATE(2020,1,1)
VAR EndDate = TODAY()

RETURN
ADDCOLUMNS(
    CALENDAR(StartDate,EndDate),
    "Year", YEAR([Date]),
    "Month Number", MONTH([Date]),
    "Month Name", FORMAT([Date],"MMMM"),
    "Year Month", FORMAT([Date],"YYYY-MM"),
    "Year Month Label", FORMAT([Date],"MMM YYYY"),
    "Month Start",
        DATE(
            YEAR([Date]),
            MONTH([Date]),
            1
        ),
    "Quarter",
        "Q" & FORMAT([Date],"Q")
)
This table provides the date attributes required for all reporting period calculations.
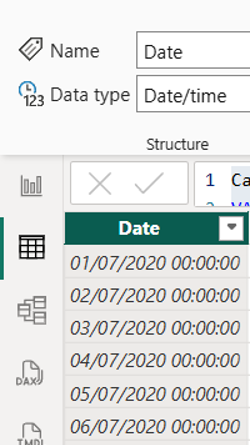
3. Once created:
Table Tools → Mark as Date Table

Select the Date column when prompted.
Step 2: Create the Reporting Period Table
The Reporting Period table allows users to choose how they want to analyse performance.
Rather than hard-coding Month-to-Date or Year-to-Date measures throughout the model, we’ll create a disconnected table containing all available reporting periods.
In Power BI: Home → Enter Data
Create the table below:
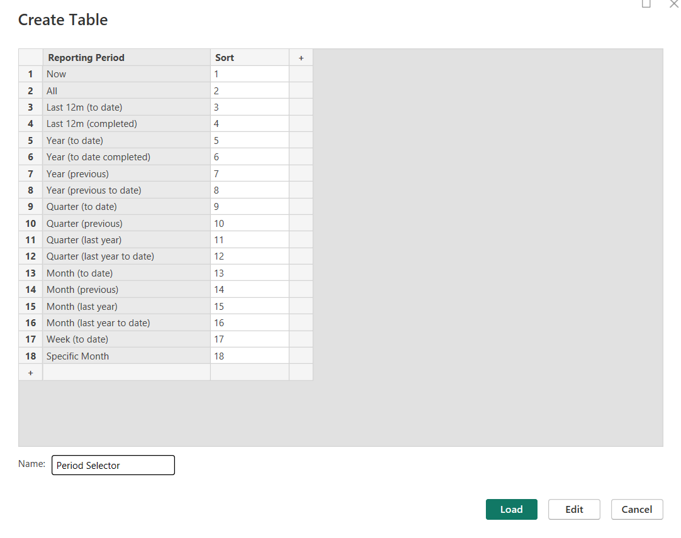
Once created, sort the Reporting Period column by the Sort column:
Column Tools → Sort by Column
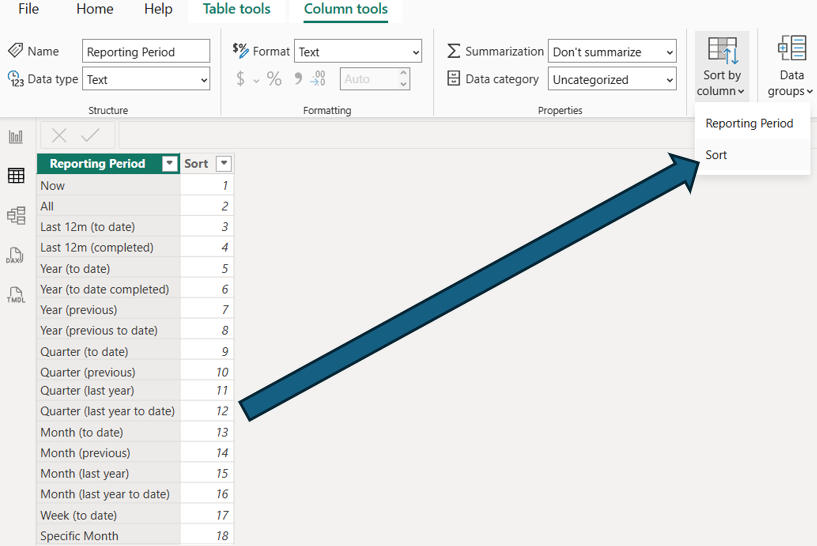
This ensures the slicer displays periods in the correct order.
Step 3: Create the Comparison Selector
Next, create a disconnected comparison table.
This table controls what the selected reporting period should be compared against.
For example:
| Reporting Period | Comparison |
| Month (previous) | Previous Month |
| Specific Month | Same Month Last Year |
| Last 12 Months | Previous Rolling 12 Months |
Create a new table: Modelling → New Table
Comparison Selector =
DATATABLE(
    "Comparison", STRING,
    {
        {"None"},
        {"Previous Period"},
        {"Previous Year"},
        {"Previous Year -1"},
        {"Previous Year -2"}
    }
)

No relationships are required.
Step 4: Create the Month Selector
The Month Selector is only required when users select Specific Month from the Reporting Period slicer.
Create a new table: Modelling → New Table
Month Selector =
SUMMARIZE(
    Calendar,
    Calendar[Month Start],
    Calendar[Year Month],
    Calendar[Year Month Label]
)
This creates a list of available reporting months that users can choose from independently of the calendar table.
Again, this table should remain disconnected.
Step 5: Create the Comparison Basis Table
Most Power BI comparisons simply compare calendar periods.
However, this can sometimes produce misleading results.
For example:
| Period | Days |
| February 2023 | 28 |
| February 2024 | 29 |
If a KPI increased by 5%, was that because performance improved or simply because there was an additional trading day?
To handle this, we’ll allow users to choose how comparison periods are calculated.
Create a new table: Modelling → New Table
Comparison Basis =
DATATABLE(
    "Basis", STRING,
    {
        {"Calendar Days"},
        {"Like For Like Days"}
    }
)
The two options are:
- Calendar Days – compares equivalent calendar periods.
- Like For Like Days – compares periods containing the same number of days.
This becomes particularly useful for ecommerce, retail and subscription-based businesses.
Step 6: Add the Report Slicers
Now that all four parameter tables have been created, the next step is to add them as slicers within your report.
Add four slicers to the report page:
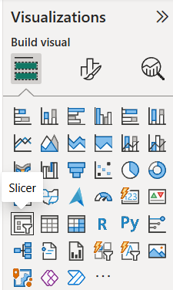
| Slicer | Field | Use Case |
| Reporting Period | Reporting Period[Reporting Period] | Controls the primary reporting window. |
| Month | Month Selector[Year Month Label] | Used when analysing a specific calendar month |
| Comparison | Comparison Selector[Comparison] | Controls the comparison methodology. |
| Comparison Basis | Comparison Basis[Basis] | Allows users to switch between Calendar Day and Like For Like Day analysis |

At this point, the report should contain four disconnected slicers ready to drive the framework.
For best results, configure each slicer as Single Select.
Format → Slicer Settings → Single Select
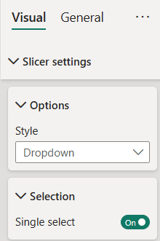
At this stage, the slicers won’t affect your measures yet.
The next steps will use DAX to read the selected values and convert them into reporting dates.
Step 7: Create Helper Measures
Now that the slicers have been created, we need a way of capturing the user’s selections.
These helper measures act as the bridge between the disconnected selector tables and the reporting logic we’ll build in the next step.
Create the following DAX measures:
Selected Period:

Selected Period =
SELECTEDVALUE(
    'Period Selector'[Reporting Period],
    "Year (to date)"
)
Selected Comparison:
Selected Comparison =
SELECTEDVALUE(
    'Comparison Selector'[Comparison],
    "Previous Year"
)
Selected Month
Selected Month =
SELECTEDVALUE(
    'Month Selector'[Month Start]
)

Selected Comparison Basis
Selected Comparison Basis =
SELECTEDVALUE(
'Comparison Basis'[Basis],
"Calendar Days"
)
These measures simply return the user’s current slicer selections and will be used throughout the rest of the framework.
Step 8: Generate Reporting Period Dates
The slicers now capture user selections, but Power BI still doesn’t know what dates those selections represent.
The next step is converting those selections into actual reporting dates.
Create three measures:
- Reporting Period Start Date
- Reporting Period End Date
- Reporting Period Days
These measures dynamically generate a reporting period based on the selected Reporting Period option.
For example:
| Reporting Period | Start Date | End Date |
| Year (to date) | 1 January Current Year | Today |
| Year (previous) | 1 January Previous Year | 31 December Previous Year |
| Month (previous) | First Day of Previous Month | Last Day of Previous Month |
| Specific Month | Selected Month Start | Selected Month End |
Create the following measures:
Reporting Period Start Date
Reporting Period Start Date =

VAR TodayDate = TODAY()
VAR CurrentQuarterStart =
    DATE(
        YEAR(TodayDate),
        (QUARTER(TodayDate)-1)*3+1,
        1
    )
RETURN
SWITCH(
    [Selected Period],
    "Now", TodayDate,
    "All", MIN(Calendar[Date]),
    "Last 12m (to date)", TodayDate - 365,
    "Last 12m (completed)", EOMONTH(TodayDate,-13)+1,
    "Year (to date)", DATE(YEAR(TodayDate),1,1),
    "Year (to date completed)", DATE(YEAR(TodayDate),1,1),
    "Year (previous)", DATE(YEAR(TodayDate)-1,1,1),
    "Year (previous to date)", DATE(YEAR(TodayDate)-1,1,1),
    "Quarter (to date)", CurrentQuarterStart,
    "Quarter (previous)", EDATE(CurrentQuarterStart,-3),
    "Quarter (last year)", EDATE(CurrentQuarterStart,-12),
    "Quarter (last year to date)", EDATE(CurrentQuarterStart,-12),
    "Month (to date)", DATE(YEAR(TodayDate),MONTH(TodayDate),1),
    "Month (previous)", EOMONTH(TodayDate,-2)+1,
    "Month (last year)", DATE(YEAR(TodayDate)-1,MONTH(TodayDate),1),
    "Month (last year to date)", DATE(YEAR(TodayDate)-1,MONTH(TodayDate),1),
    "Week (to date)", TodayDate-WEEKDAY(TodayDate,2)+1,
    "Specific Month", [Selected Month]
)

Reporting Period End Date
Reporting Period End Date =
VAR TodayDate = TODAY()
VAR CurrentQuarterStart =
DATE(
YEAR(TodayDate),
(QUARTER(TodayDate)-1)*3+1,
1
)
RETURN
SWITCH(
[Selected Period],
"Now", TodayDate,
"All", TODAY(),
"Last 12m (to date)", TodayDate,
"Last 12m (completed)", EOMONTH(TodayDate,-1),
"Year (to date)", TodayDate,
"Year (to date completed)", EOMONTH(TodayDate,-1),
"Year (previous)", DATE(YEAR(TodayDate)-1,12,31),
"Year (previous to date)",
DATE(
YEAR(TodayDate)-1,
MONTH(TodayDate),
DAY(TodayDate)
),
"Quarter (to date)", TodayDate,
"Quarter (previous)", CurrentQuarterStart-1,
"Quarter (last year)", EDATE(CurrentQuarterStart,-9)-1,
"Quarter (last year to date)", EDATE(TodayDate,-12),
"Month (to date)", TodayDate,
"Month (previous)", EOMONTH(TodayDate,-1),
"Month (last year)", EOMONTH(
DATE(
YEAR(TodayDate)-1,
MONTH(TodayDate),
1
),
0
),
"Month (last year to date)",
DATE(
YEAR(TodayDate)-1,
MONTH(TodayDate),
DAY(TodayDate)
),
"Week (to date)", TodayDate,
"Specific Month", EOMONTH([Selected Month],0)
)
Reporting Period DaysReporting Period Days =
DATEDIFF(
[Reporting Period Start Date],
[Reporting Period End Date],
DAY
) + 1
Step 9: Generate Comparison Dates
With the reporting period now established, the next step is generating an equivalent comparison period based on the user’s selected comparison option.
For example:
| Reporting Period | Comparison |
| Month (previous) | Previous Month |
| Month (last year) | Same Month Last Year |
| Last 12m (to date) | Previous Rolling 12 Months |
| Specific Month | Equivalent Month Last Year |
Create the measure:
Comparison Start Date Measure
Comparison Period Start Date =
VAR Comparison =
    [Selected Comparison]
VAR PeriodDays =
    [Reporting Period Days]
VAR Basis =
    [Selected Comparison Basis]
RETURN
SWITCH(

    Comparison,
    "Previous Period",
        [Reporting Period Start Date] - PeriodDays,
    "Previous Year",
        IF(
            Basis = "Like For Like Days",
            [Reporting Period Start Date] - 364,
            EDATE([Reporting Period Start Date], -12)
        ),
    "Previous Year -1",
        IF(
            Basis = "Like For Like Days",
            [Reporting Period Start Date] - (364 * 2),
            EDATE([Reporting Period Start Date], -24)
        ),
    "Previous Year -2",
        IF(
            Basis = "Like For Like Days",
            [Reporting Period Start Date] - (364 * 3),
            EDATE([Reporting Period Start Date], -36)
        )
)
Comparison Period End Date Measure
Comparison Period End Date =
VAR Comparison =
    [Selected Comparison]
VAR Basis =
    [Selected Comparison Basis]
RETURN
SWITCH(
    Comparison,
    "Previous Period",
        [Reporting Period Start Date] - 1,
    "Previous Year",
        IF(
            Basis = "Like For Like Days",
            [Reporting Period End Date] - 364,
            EDATE([Reporting Period End Date], -12)
        ),
    "Previous Year -1",
        IF(
            Basis = "Like For Like Days",
            [Reporting Period End Date] - (364 * 2),
            EDATE([Reporting Period End Date], -24)
        ),
    "Previous Year -2",
        IF(
            Basis = "Like For Like Days",
            [Reporting Period End Date] - (364 * 3),
            EDATE([Reporting Period End Date], -36)
        )
)

Comparison Period Day Count
Comparison Period Days =
DATEDIFF(
[Comparison Period Start Date],
[Comparison Period End Date],
DAY
) + 1Step 10: Test the Framework
At this point, the framework is complete and can dynamically generate both reporting periods and comparison periods based on user selections.
To test the framework, create a table visual and add the following measures:
- Reporting Period Start Date
- Reporting Period End Date
- Reporting Period Days
- Comparison Period Start Date
- Comparison Period End Date
- Comparison Period Days
Add the following slicers to the page:
- Reporting Period
- Month
- Comparison
- Comparison Basis
Try different combinations of selections and verify that the dates update correctly.
For example:
| Setting | Selection |
| Reporting Period | Specific Month |
| Month | February 2024 |
| Comparison | Previous Year |
| Comparison Basis | Like For Like Days |
Produces:
| Measure | Result |
| Reporting Period Start Date | 01/02/2024 |
| Reporting Period End Date | 29/02/2024 |
| Reporting Period Days | 29 |
| Comparison Period Start Date | 02/02/2023 |
| Comparison Period End Date | 02/03/2023 |
| Comparison Period Days | 29 |
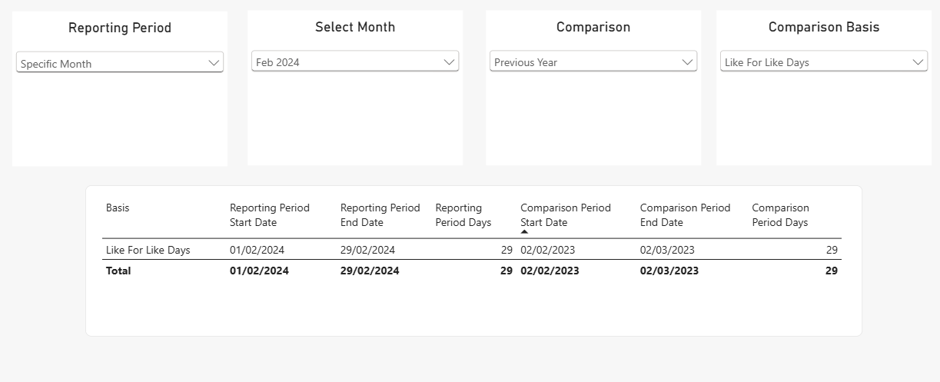
Because both periods contain the same number of days, the comparison is more meaningful than simply comparing February 2024 against February 2023.
This also demonstrates why the Comparison Basis selector can be valuable when comparing periods that contain different numbers of trading days.
If the returned dates match your expectations across different slicer combinations, the framework is ready to be reused throughout your semantic model.
Using the Framework in Your Semantic Model
The purpose of this framework is to generate reusable reporting and comparison date ranges that can be referenced by any KPI measure.
Examples include:
- Revenue
- Orders
- Gross Profit
- Margin
- Customers
- Website Sessions
- Conversion Rate
Rather than creating separate Year-to-Date, Previous Month and Previous Year versions of every measure, KPIs can reference the dynamic reporting dates generated by the framework.
This ensures consistent time intelligence logic across every report and dashboard.
Final Thoughts
In this guide, we’ve built a reusable time intelligence framework using disconnected parameter tables, helper measures and dynamic date calculations.
The completed solution supports:
- 18 reporting period options
- Previous period comparisons
- Multi-year comparisons
- Specific month selection
- Calendar Day comparisons
- Like For Like Day comparisons
Because the reporting logic is centralised within the semantic model, it only needs to be built once. New reports can then consume the same reporting periods, comparison periods and Like For Like Day calculations without recreating the logic each time. As reporting requirements evolve, the framework can easily be extended to support financial years, rolling periods and custom date ranges.