
Data Visualisation Consulting & Dashboard Development
Transform complex data into intuitive dashboards that improve visibility, support better decisions and drive user adoption.
What Is Data Visualisation Consulting?
Data visualisation consulting helps organisations transform complex data into clear, intuitive dashboards and reporting solutions that support better decision-making.
Effective data visualisation combines dashboard design, KPI development, user experience and business insight to ensure stakeholders can quickly understand performance and take action.
Our Consultants Help Organisations:
- Design intuitive dashboards and scorecards
- Improve reporting usability and adoption
- Create consistent KPI frameworks
- Present complex information clearly
- Develop executive and operational reporting
- Build visualisations that support business decisions
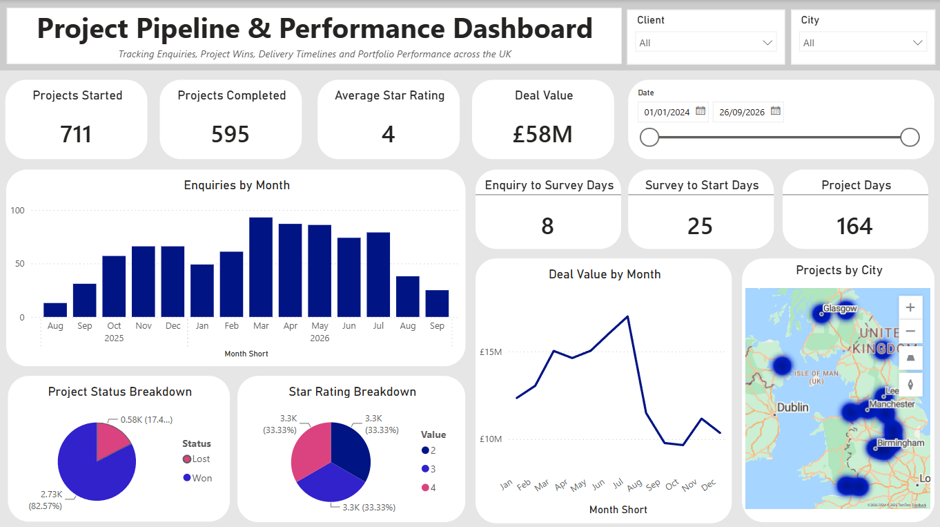

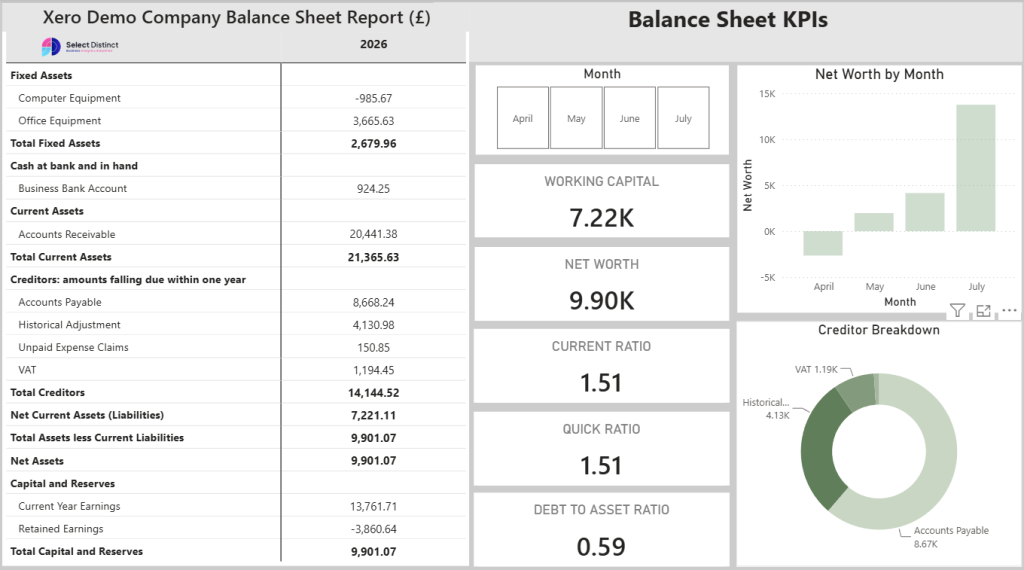
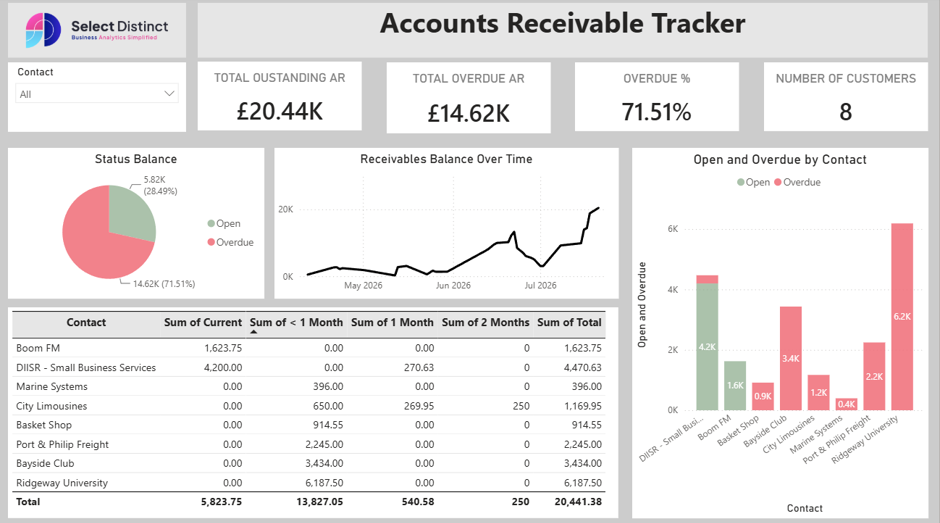
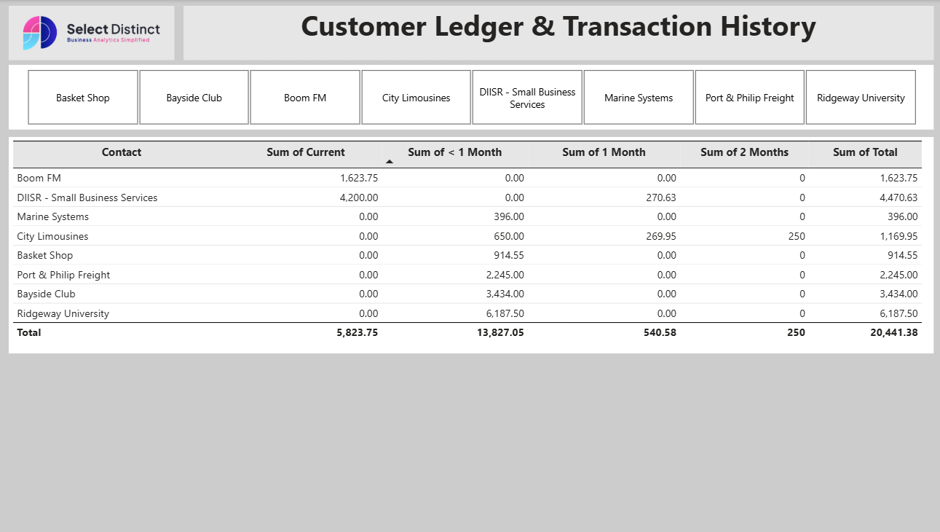
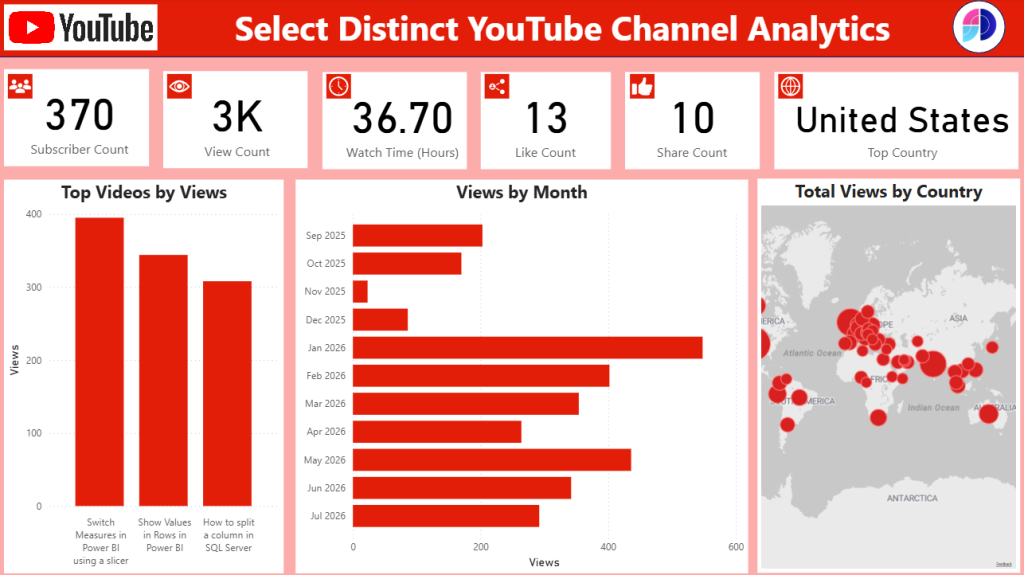
Benefits of Effective Data Visualisation
Effective data visualisation helps organisations move beyond static reports and spreadsheets, providing clear insight that supports better decisions, faster analysis and greater user engagement.
Enhanced Visibility
Gain instant access to key metrics, KPIs and business performance insights through intuitive dashboards designed for clarity.
Better Decision-Making
Support confident, data-driven decisions with clear, reliable reporting and visual analytics aligned to business objectives.
Improved User Adoption
Create dashboards that stakeholders can easily understand, trust and use consistently across the organisation.
Reduced Reporting Effort
Automate manual reporting processes and reduce the time spent creating, updating and distributing spreadsheets.
Complete Performance Visibility
Monitor operational, financial and commercial performance in one place with dashboards that provide a complete view of business activity.
Stronger KPI Alignment
Our Data Visualisation Consulting Approach
Our structured approach ensures dashboards and reporting solutions are designed around business objectives, user needs and actionable insight.
1. Discovery & Requirements Gathering
Understand business objectives, reporting challenges, stakeholders and decision-making requirements.
2. KPI & Reporting Framework Design
Define the metrics, KPIs and reporting structures that will provide meaningful visibility of performance.
3. Dashboard & Visualisation Design
Create intuitive dashboard layouts and visualisations that make complex information easy to understand.
4. Development & Implementation
Build dashboards and reporting solutions using the most appropriate tools and technologies.
5. Review & Optimisation
Gather user feedback, improve adoption and refine visualisations to maximise business value.
6. Ongoing Support & Enhancement
Ensure dashboards continue to evolve alongside changing business requirements.
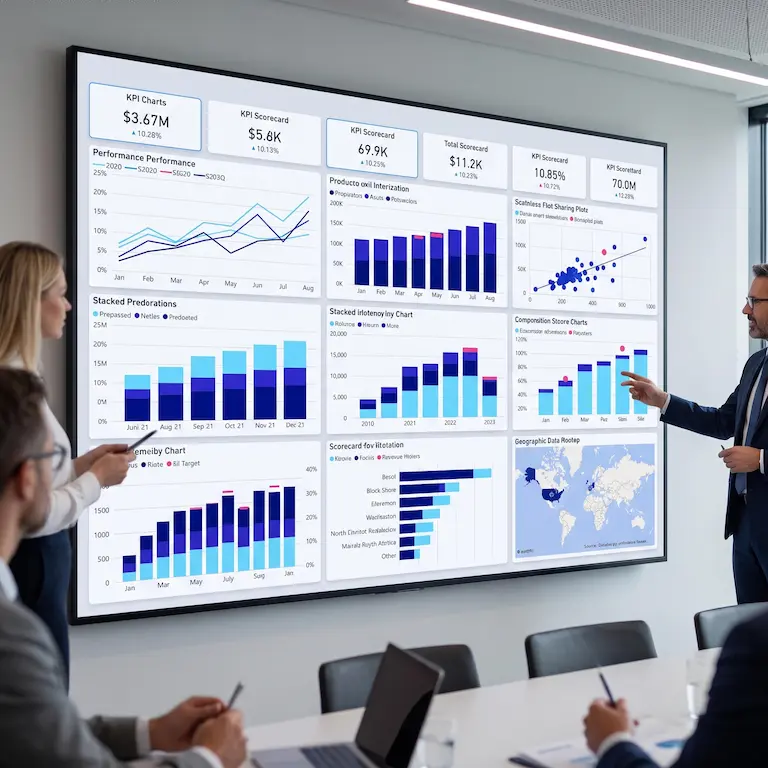
Data Visualisation Case Studies
Explore more dashboard development, reporting and data visualisation projects delivered across a range of industries.




Why Organisations Choose Select Distinct
Independent, service-led consulting focused on business outcomes
Registered Management Accounting Practice with strong reporting expertise
Specialists in dashboard design, KPI frameworks and business intelligence
Practical data visualisation solutions that improve reporting adoption
Collaborative approach that helps teams build confidence in reporting
Data Visualisation FAQs
What is data visualisation consulting?
Data visualisation consulting helps organisations transform complex data into clear, intuitive dashboards and reports that support better decision-making. This includes dashboard design, KPI frameworks, reporting optimisation and business intelligence solutions.
What makes an effective dashboard?
An effective dashboard presents the right information to the right audience at the right time. Good dashboard design focuses on clarity, usability, meaningful KPIs and actionable insights rather than overwhelming users with data.
Can you improve our existing dashboards and reports?
Yes. We can review existing dashboards, reports and KPI frameworks to identify opportunities to improve usability, reporting consistency, stakeholder engagement and business value.
Which data visualisation and dashboard tools do you support?
We work with a range of reporting and business intelligence platforms, including Microsoft Power BI, Tableau, Google Data Studio and Excel-based reporting solutions.
Can you help migrate existing reports to Power BI?
Yes. We can migrate legacy reports, spreadsheets and reporting solutions into modern Power BI environments, helping organisations improve scalability, automation and reporting effectiveness.