If you followed last week’s guide on building a clean, executive-ready Profit & Loss statement, you already know that raw data exported straight from accounting software rarely looks boardroom-ready out of the box.
Just like a P&L, transforming a messy ledger export into a polished, professional Balance Sheet in Power BI comes down to three core steps: structuring your data, setting up a clean financial hierarchy, and applying consistent visual formatting.
Here is how to build the balance side of your financial report to match your P&L layout.
Stage 1: Data Extraction & Preparation
Just as you did for your P&L, you will need to pull your data source files from Xero:
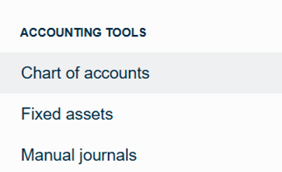
1.The Chart of Accounts: Export your master list of accounts from Xero and save it as an Excel workbook (.xlsx)
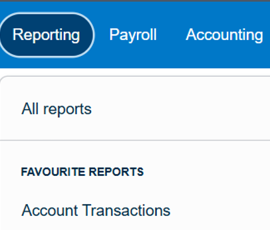
2. Transaction Data: Export your Account Transactions, ensuring you include core columns like Date, Account, Account Code, and Net/Amount fields
3.Filter for Balance Sheet Accounts: Unlike a P&L (which only tracks Revenue and Expense), your Balance Sheet accounts will include Assets, Liabilities, and Equity.
Filter your transaction dataset in Excel to include these statement types before loading them into Power BI
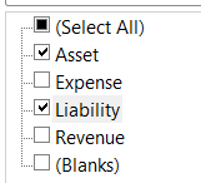
Tip: To avoid confusion, copy and paste the filtered data onto a separate tab on the excel sheet
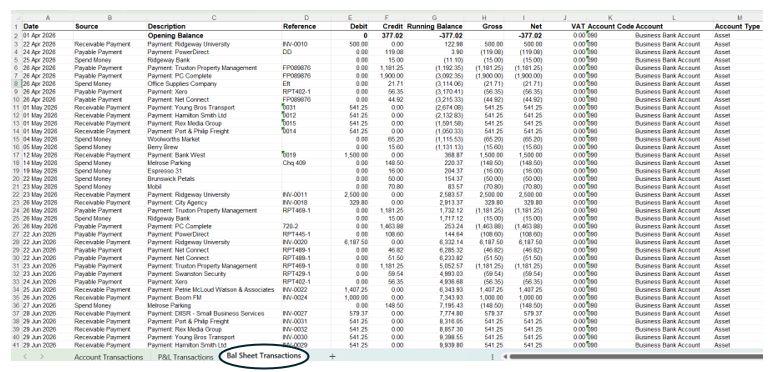
4.Include Opening Balances: Because a Balance Sheet tracks cumulative financial health rather than resetting annually, you may need to manually enter these opening balances on the spreadsheet (for example, brought-forward figures like retained earnings or historical adjustments).
We date ours the first day of the financial year so that they pull correctly into the balance sheet and reflect an accurate starting financial position.

Stage 2: Building Mapping Tables
Power BI won’t automatically know the strict accounting hierarchy required for a Balance Sheet unless you give it a structural view.
1.Create a Balance Sheet Mapping Table:
Go to Home > Enter Data in Power BI and create a mapping table that lists your primary sections in exact corporate order:
- Fixed Assets
- Current Assets
- Creditors: amounts falling due within one year (Short-term liabilities)
- Net Current Assets (Liabilities)
- Capital and Reserves
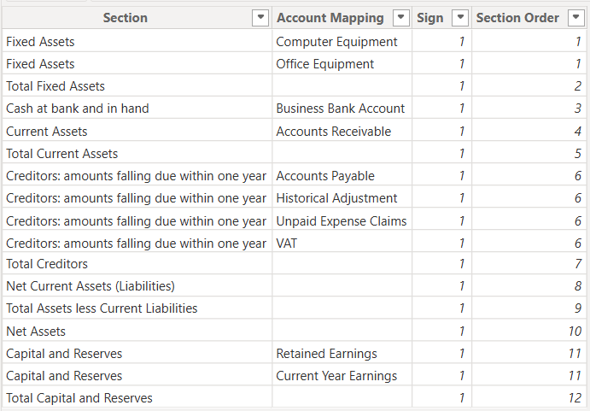
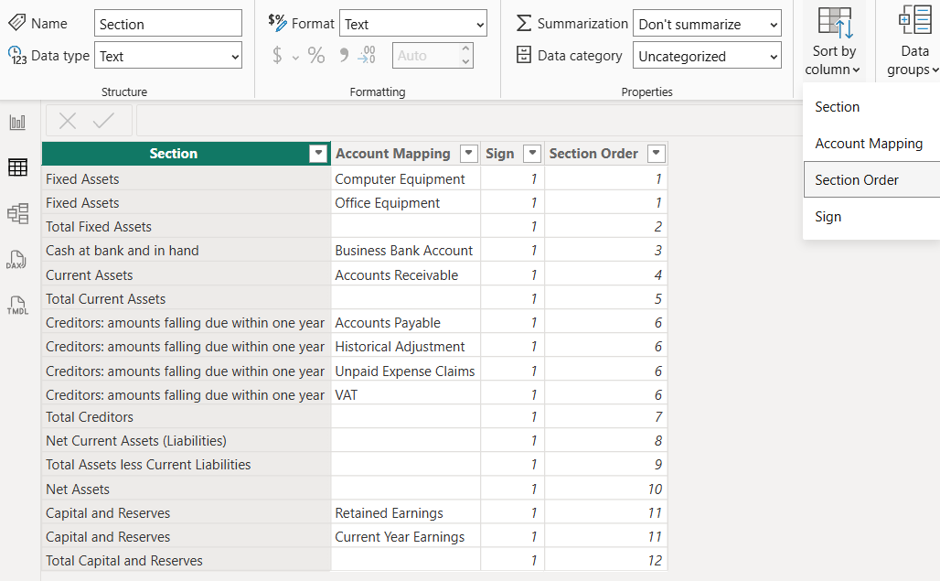
2.Add a Custom Sort Column: Include a numerical sort index (1, 2, 3…) alongside your section names and use Sort by Column so your report flows logically from top to bottom.
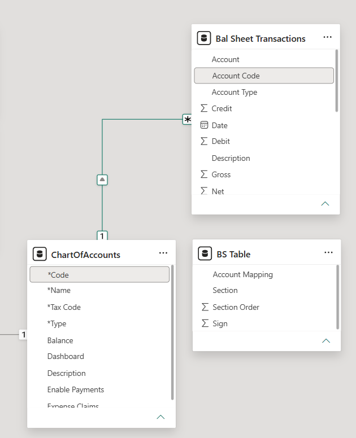
3.Build Relationships: Connect your ChartOfAccounts and Transactions tables using a 1-to-Many relationship on the account codes.
Stage 3: Building the Dynamic Balance Sheet DAX Measure
Step 1: Set Up Reusable Variables and Date Filters
Unlike a Profit & Loss statement (which resets every year), a Balance Sheet requires cumulative tracking.
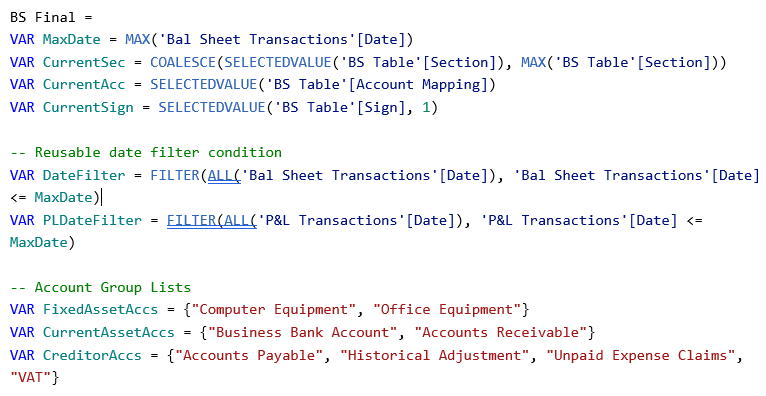
We begin by setting up our date filters, section lookups, and reusable account group lists to keep our measure clean.
BS Final =
VAR MaxDate = MAX('Bal Sheet Transactions'[Date])
VAR CurrentSec = COALESCE(SELECTEDVALUE('BS Table'[Section]), MAX('BS Table'[Section]))
VAR CurrentAcc = SELECTEDVALUE('BS Table'[Account Mapping])
VAR CurrentSign = SELECTEDVALUE('BS Table'[Sign], 1)

-- Reusable date filter condition
VAR DateFilter = FILTER(ALL('Bal Sheet Transactions'[Date]), 'Bal Sheet Transactions'[Date] <= MaxDate)
VAR PLDateFilter = FILTER(ALL('P&L Transactions'[Date]), 'P&L Transactions'[Date] <= MaxDate)

-- Account Group Lists
VAR FixedAssetAccs = {"Computer Equipment", "Office Equipment"}
VAR CurrentAssetAccs = {"Business Bank Account", "Accounts Receivable"}
VAR CreditorAccs = {"Accounts Payable", "Historical Adjustment", "Unpaid Expense Claims", "VAT"}
Step 2: Calculate Core Balances and Earnings
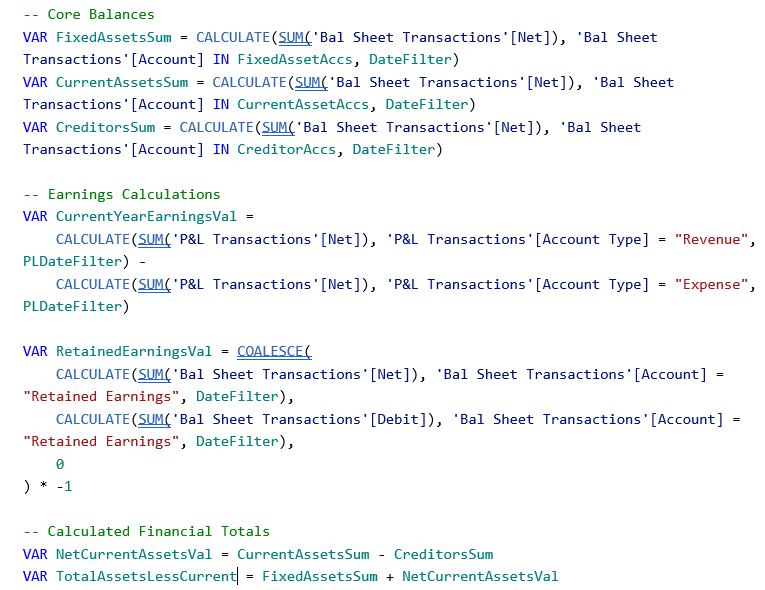
Next, we calculate our major section sums and pull in the current year’s earnings from the P&L tables, alongside a helper variable to handle Retained Earnings safely.
-- Core Balances
VAR FixedAssetsSum = CALCULATE(SUM('Bal Sheet Transactions'[Net]), 'Bal Sheet Transactions'[Account] IN FixedAssetAccs, DateFilter)
VAR CurrentAssetsSum = CALCULATE(SUM('Bal Sheet Transactions'[Net]), 'Bal Sheet Transactions'[Account] IN CurrentAssetAccs, DateFilter)
VAR CreditorsSum = CALCULATE(SUM('Bal Sheet Transactions'[Net]), 'Bal Sheet Transactions'[Account] IN CreditorAccs, DateFilter)

-- Earnings Calculations
VAR CurrentYearEarningsVal =
    CALCULATE(SUM('P&L Transactions'[Net]), 'P&L Transactions'[Account Type] = "Revenue", PLDateFilter) -
    CALCULATE(SUM('P&L Transactions'[Net]), 'P&L Transactions'[Account Type] = "Expense", PLDateFilter)

VAR RetainedEarningsVal = COALESCE(
    CALCULATE(SUM('Bal Sheet Transactions'[Net]), 'Bal Sheet Transactions'[Account] = "Retained Earnings", DateFilter),
    CALCULATE(SUM('Bal Sheet Transactions'[Debit]), 'Bal Sheet Transactions'[Account] = "Retained Earnings", DateFilter),
    0
) * -1

-- Calculated Financial Totals
VAR NetCurrentAssetsVal = CurrentAssetsSum - CreditorsSum
VAR TotalAssetsLessCurrent = FixedAssetsSum + NetCurrentAssetsVal
Step 3: Route Sections and Accounts Using SWITCH
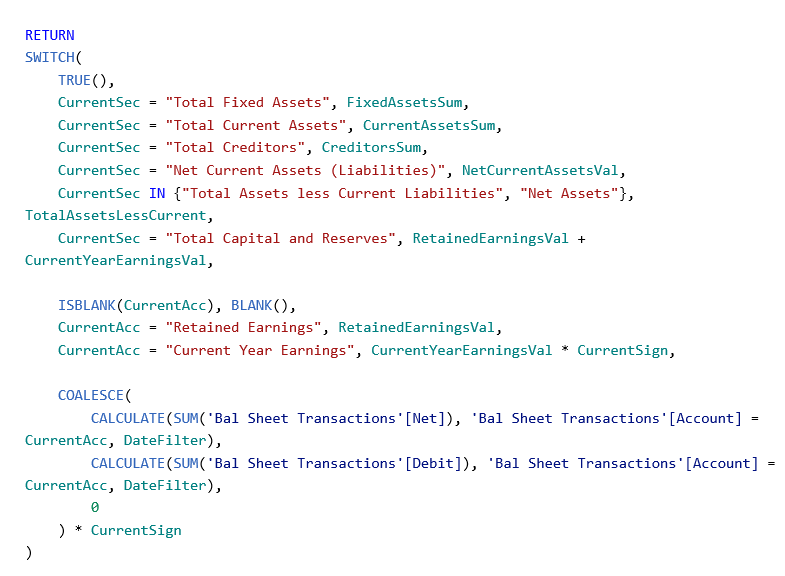
Finally, use a streamlined SWITCH statement to route each section subtotal, handle summary rows, hide empty placeholders, and fetch individual account balances.
RETURN
SWITCH(
    TRUE(),
    CurrentSec = "Total Fixed Assets", FixedAssetsSum,
    CurrentSec = "Total Current Assets", CurrentAssetsSum,
    CurrentSec = "Total Creditors", CreditorsSum,
    CurrentSec = "Net Current Assets (Liabilities)", NetCurrentAssetsVal,
    CurrentSec IN {"Total Assets less Current Liabilities", "Net Assets"}, TotalAssetsLessCurrent,
    CurrentSec = "Total Capital and Reserves", RetainedEarningsVal + CurrentYearEarningsVal,

    ISBLANK(CurrentAcc), BLANK(),
    CurrentAcc = "Retained Earnings", RetainedEarningsVal,
    CurrentAcc = "Current Year Earnings", CurrentYearEarningsVal * CurrentSign,

    COALESCE(
        CALCULATE(SUM('Bal Sheet Transactions'[Net]), 'Bal Sheet Transactions'[Account] = CurrentAcc, DateFilter),
        CALCULATE(SUM('Bal Sheet Transactions'[Debit]), 'Bal Sheet Transactions'[Account] = CurrentAcc, DateFilter),
        0
    ) * CurrentSign
)
Stage 4: Building the Balance Sheet Matrix Visual
With your mapping tables structured, your opening balances pulled through via your spreadsheet, and your dynamic DAX measure written, it’s time to bring everything together into a clean visual.
1.Select the Matrix Visual: Add a standard Matrix visual to your report canvas.
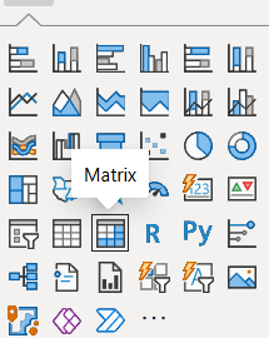
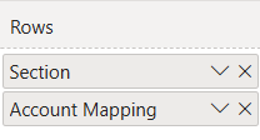
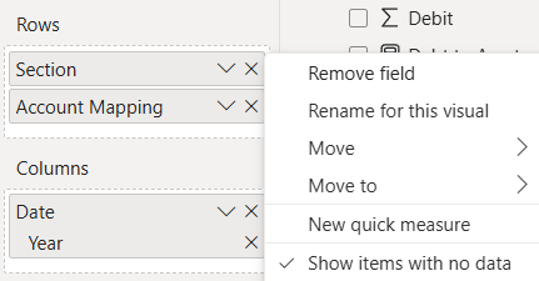
2.Drag and Drop Your Fields:
Rows: Drag your Section and Account Mapping fields from your Balance Sheet mapping table.
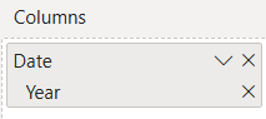
Columns: Drag your Date field (set to Year or Month/Year rather than the default day-by-day hierarchy to prevent horizontal scrolling).
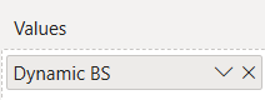
Values: Drop in your newly created Dynamic BS measure.
3.Show Items with No Data: Just like your P&L setup, make sure you right-click your row field and toggle Show items with no data so that your sections and category headers render cleanly even if a particular month has no activity.
Stage 5: Apply Executive Formatting & Polish
If you created the P&L from our previous blog, you should be able to use the Format Painter to instantly get the Balance Sheet visually looking like the P&L style.
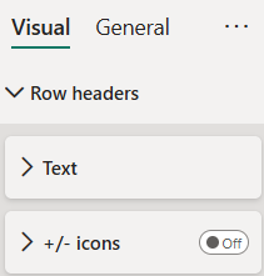
Toggle off expansion icons: Once you have expanded your matrix rows to display what each line needs to show, turn off the +/- row headers in the formatting pane for a cleaner, static report look.
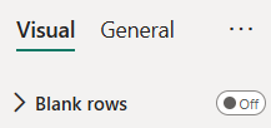
Remove extra blank rows: Toggle off empty rows to keep the layout tight and professional.
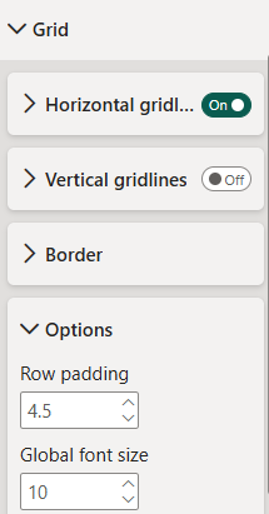
Increase row padding: Adjust the row padding settings upward to give the text breathing room, stretching the balance sheet nicely across your dashboard canvas.
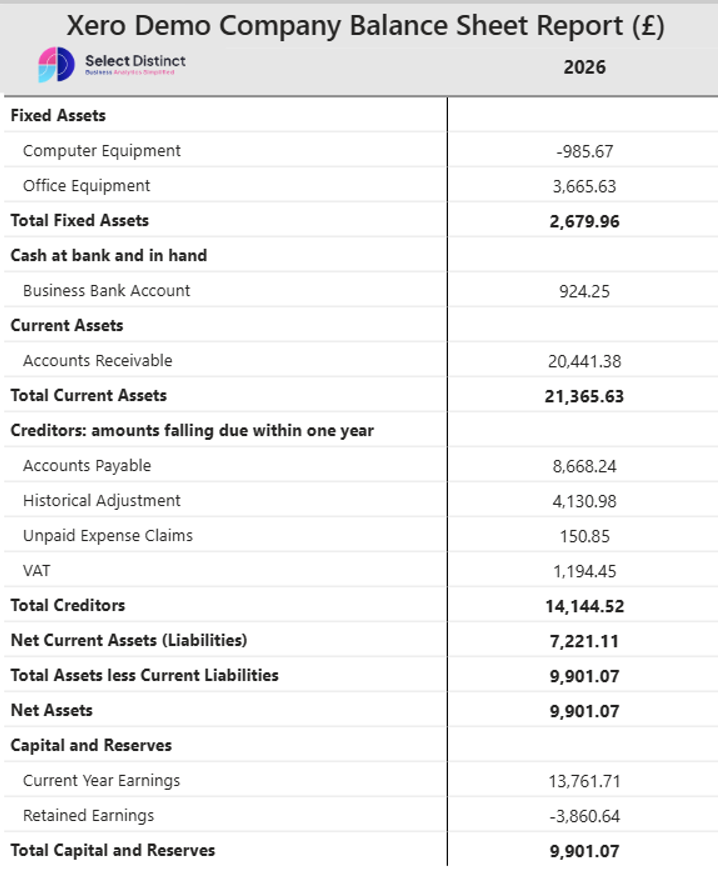
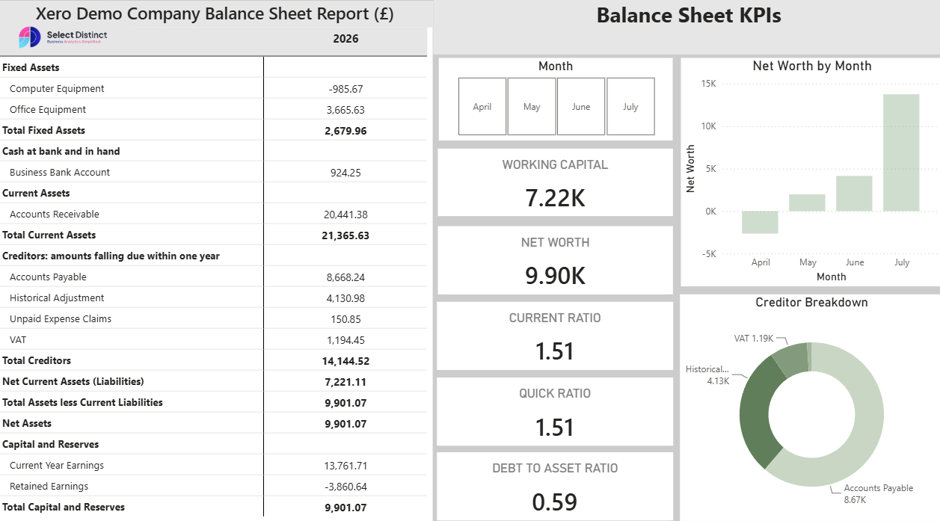
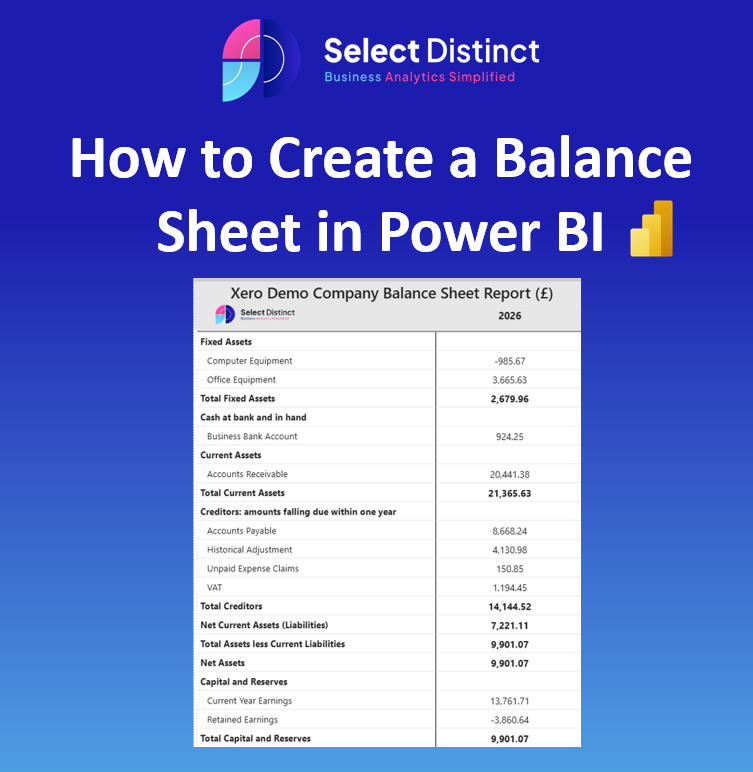
Now you should be able to recreate a balance sheet similar to above.
Once you have your working balance sheet, you can add extra KPIs and visuals to your dashboard, such as a net worth trend chart, current and quick ratios, and a creditor breakdown donut chart as shown above.