
Tableau Overview: Expert Insights & Data Visualisation Services
Tableau is one of the most powerful and user-friendly business intelligence tools available today. It enables users to transform raw data into interactive dashboards and visual stories that drive better decisions. In this overview, we explore Tableau’s core features, benefits, and how it fits into modern analytics workflows.

What is Tableau? – A Tableau Overview
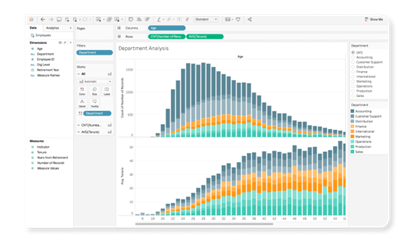
Tableau is a data visualisation tool that allows users to connect to a wide range of data sources. Including databases, spreadsheets, and cloud services.
Once connected, Tableau provides a user-friendly interface for exploring and analysing data. Making it easy to identify trends, patterns, and outliers.
Users can create interactive management dashboards. To allow viewers to filter, sort, and drill down into the data. providing a more detailed understanding of the insights presented.
You can get a free trial of the software from Tableau.
Business intelligence and analytics software (tableau.com)
Powerful Capabilities
One of the key benefits of Tableau is its ability to handle large and complex datasets. Tableau’s high-performance data engine allows users to work with massive datasets in real-time. This is without the need for complex pre-processing or data modelling. This allows users to quickly generate insights and explore different scenarios. Without being limited by the size or complexity of the data. Tableau also provides a wide range of data visualisation options, including charts, graphs, maps, and more. Users can customize the appearance and functionality of their visualisations as required. Users can even create custom calculations and metrics using Tableau’s formula language. Tableau also provides advanced analytical capabilities, such as forecasting, clustering, and trend analysis. These can help users uncover deeper insights and make more informed decisions.
Supportive Community
Another key benefit of Tableau is its ease of use and flexibility. Tableau is accessible to users of all skill levels, from beginners to data experts. Tableau also provides a wide range of integration options. Allowing users to connect to other software tools and services, such as Salesforce, Google Analytics, and Hadoop. Businesses and organizations can create a more cohesive and integrated data ecosystem. This allows them to leverage data from many sources and applications. There is a strong community of users and support resources. Tableau’s user community is one of the largest and most active in the data visualisation space. The community provide a wealth of knowledge, tips, and best practices. Tableau also has extensive training resources, including free online courses, tutorials, and documentation. Making it easy for users to get up to speed with the platform.
Summary
Tableau is a powerful data visualisation and analysis platform. It provides businesses and organizations with the tools they need to gain insights into their data. With its intuitive interface, high-performance data engine, and advanced analytical capabilities. Looking to make data-driven decisions and improve business performance? Tableau is a credible option Whether you’re a small business looking for data consultancy, a data analyst, or a large enterprise. Tableau can help you unlock the power of your data and transform it into actionable insights.
Related Posts



Frequently Asked Questions
What are the primary strengths of Tableau compared to other BI tools?
Tableau is renowned for its advanced data visualisation capabilities and its ability to handle complex, large-scale data explorations.
Unlike standard reporting tools, Tableau allows for high levels of interactivity and sophisticated graphical analysis, making it the preferred choice for organisations that need to uncover deep, non-obvious patterns within their data.
How do I improve the performance of a slow Tableau workbook?
Tableau performance is often hindered by overly complex calculations, excessive data blending, or trying to display too much information on a single dashboard.
We optimise performance by using extracts instead of live connections where appropriate, minimising the number of filters, simplifying complex calculations, and ensuring the underlying data model is structured correctly in a data warehouse before it reaches Tableau.
What is the difference between Tableau Desktop, Server, and Cloud?
Tableau Desktop is the local application used for building and editing visualisations.
Tableau Server is an on-premise platform for hosting, governing, and sharing reports across your organisation.
Tableau Cloud is the fully managed, SaaS version of the server platform, which removes the need for hardware maintenance while providing the same enterprise-grade security and distribution capabilities.
Can Tableau connect to cloud data warehouses like BigQuery?
Yes. Tableau has native, high-performance connectors for virtually every major cloud data warehouse, including Google BigQuery, Snowflake, and Azure SQL.
Connecting Tableau to a data warehouse allows you to leverage the processing power of the cloud, ensuring your dashboards remain fast and responsive even when visualising millions of rows of data.
How can I ensure data governance and security in Tableau?
Tableau ensures data security through robust user-based permissions and Row-Level Security (RLS).
By defining exactly what data each user is authorised to see at the source level or through Tableau’s internal filtering protocols you can share dashboards confidently across large departments or with external clients without the risk of exposing sensitive information.