Services

Technologies

Industries

About Us

Our Work - Case Studies

Business Analytics Blog Power BI

Data Insights & Practical BI Guidance
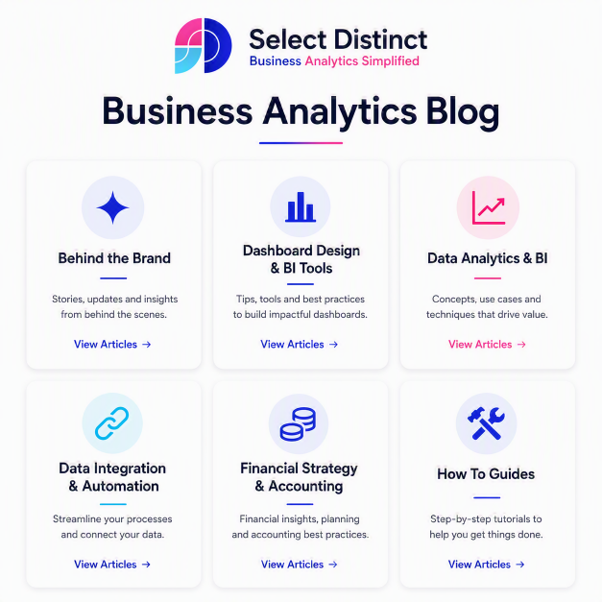
Business Analytics Blog

Strategic Insights

The Select Distinct Business Analytics Blog is your hub for practical, real‑world guidance on Power BI, SQL, data analytics, automation, and management reporting.

Whether you’re building dashboards, improving data processes, or levelling up your analytics skills, this blog provides clear, actionable tutorials designed for busy professionals.

You’ll find hands‑on walkthroughs, time‑saving techniques, and strategic insights that help you solve real business problems — not just learn software features.

With content spanning Power BI, SQL Server, BigQuery, Excel, data warehousing, automation, and leadership, the blog supports analysts, managers, and business teams who want to make better decisions with data.

New posts are added regularly, covering everything from foundational concepts to advanced modelling, reporting, and integration techniques.
If you want to build reliable analytics, streamline reporting, and understand the “why” behind BI best practices, this blog is built for you.

Welcome to the Business Analytics Blog

Business analytics should make your work clearer, not more complicated. This blog is here to help you get there. Whether you’re building dashboards in Power BI, writing SQL to clean and shape data, or trying to make sense of data modelling and reporting best practices, you’ll find practical guidance you can actually use.

Every article is written with real business problems in mind — the kind analysts, managers, and teams face every day. You’ll learn how to design cleaner dashboards, automate repetitive reporting, improve data quality, and turn raw information into insights people can trust.

If you want to strengthen your analytics skills, understand Power BI more deeply, or build a more confident approach to business intelligence, this blog gives you the tools, techniques, and clarity to move forward.

This Blog Is Ideal For:

Data Analysts & BI Developers

Build and scale BI infrastructure.

Finance & Operations Teams

Optimize assets and internal workflows.

Learners Wanting To Understand Data

Grasp core data concepts easily.

SQL & Power BI Learners

Master queries and visual reports.

Reporting Managers

Track KPIs and team performance.

Small Business Owners

Grow and manage your venture.

Category Filter

Tag Filter

Latest Posts

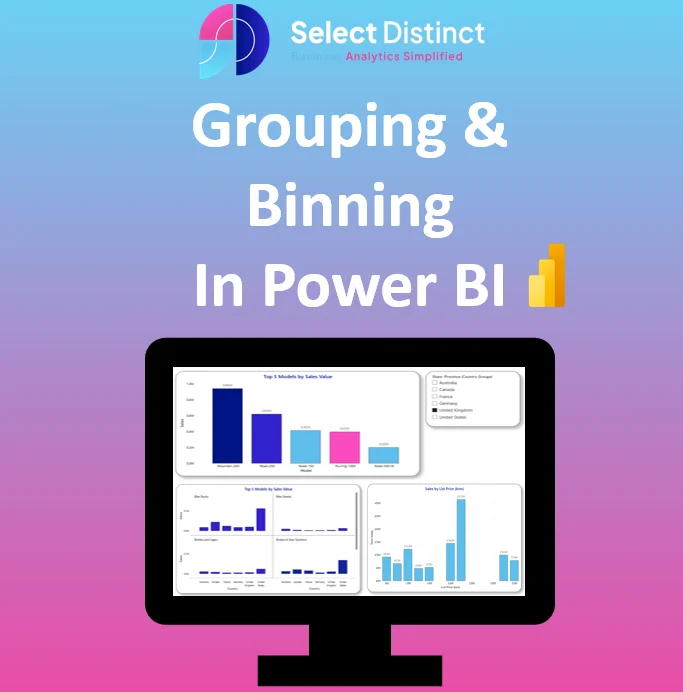
Grouping & Binning in Power BI

Grouping & Binning in Power BI
Learn how grouping and binning in Power BI help you turn raw values into clear, meaningful ranges. This guide shows how to segment data, reveal patterns, and add cumulative views for deeper insight across sales, expenses, operations, and customer behaviour.

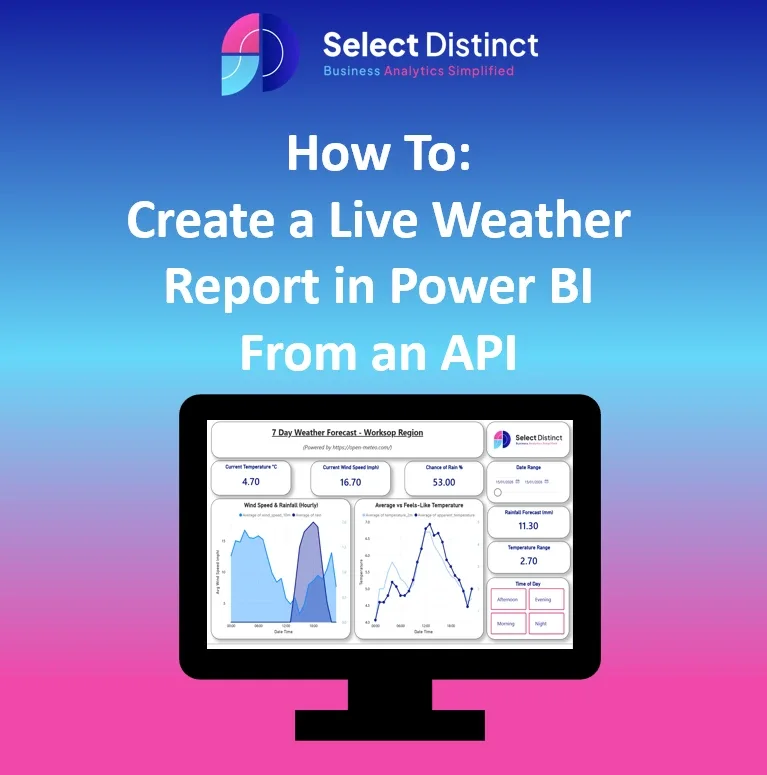
From API to Dashboard: Create a Live Weather Report in Power BI

How To: Create a Live Weather Report in Power BI From an API
Build your first live data dashboard in Power BI. This guide shows you how to connect to a free weather API, shape the data, and create clean KPIs and trend visuals — no API key required.

Power BI Filters Explained: Visual, Page & Report-Level

Power BI Filters Explained: Visual, Page & Report Level
Visual, Page, and Report‑level filters each shape your Power BI story differently. This guide shows you how they work — and how to use them together to build clean, consistent, beginner‑friendly reports.

Introduction to Power BI Concepts

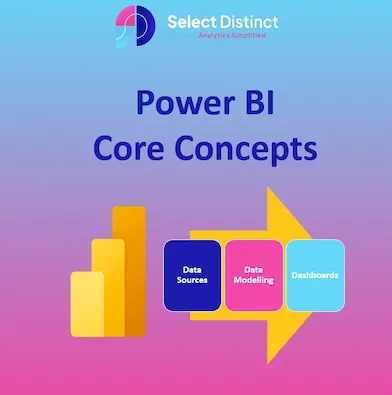
Power BI Core Concepts: Data Sources, Data Modelling and Dashboards
Power BI is built on three core concepts: data sources, modelling, and dashboards. This guide explains how they work together — and why mastering them is the key to creating clear, reliable, insight‑driven reports.

Introducing Our New Power BI Glossary

Power BI Glossary Image
Meet the Power BI Glossary: a visual, beginner‑friendly reference that explains the terms you use every day — without the jargon. Fast lookup, clear examples, and practical guidance for analysts, creators, and learners.

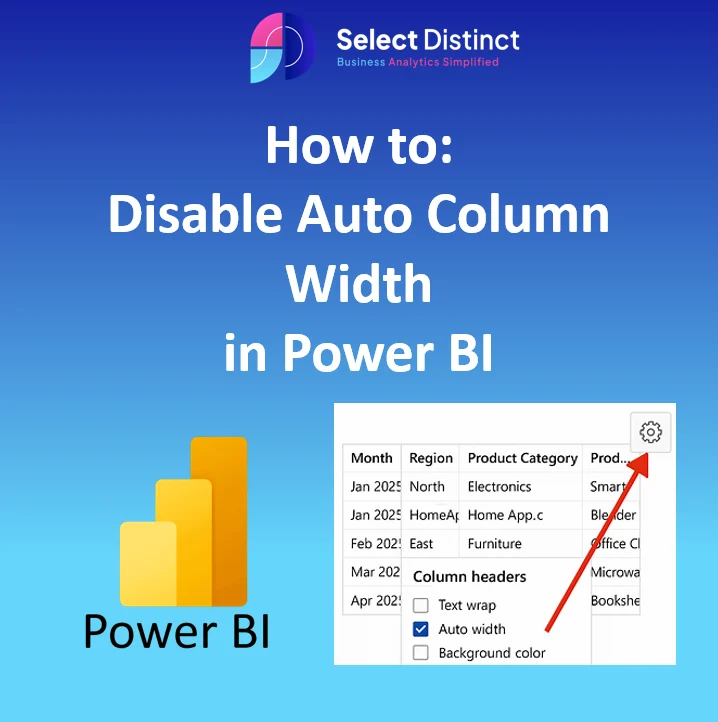
How to Disable Auto Column Width in Power BI

How To: Disable Auto Column Width in Power BI
Power BI loves to resize your table columns — even when you don’t want it to. This quick guide shows you exactly how to disable Auto Column Width, why it keeps switching back on, and how to keep your layouts stable across pages and refreshes.

A Special Touch from Kiveton Park FC

Framed Kiveton park football club shirt with the select distinct sponsor logo
Some gestures stay with you long after the moment passes. This short story from Kiveton Park FC captures the kind of kindness that reminds you why grassroots football matters — the people, the pride, and the unexpected ways a club can make someone’s day feel a little brighter.

Enhance Your Xero P&L in Power BI

Power BI P&L Dashboard Integration with Xero | Select Distinct Business Analytics
If your Xero P&L feels too flat for real analysis, Power BI can transform it. This guide shows you how to reshape your data, add meaningful structure, and build a clearer, more insightful P&L — without changing anything in Xero. A simple upgrade with a big impact.

Smarter Navigation, Better Insights – Our Blog Just Got an Upgrade!

Business Analytics Blog Updated
Our blog just became easier to explore. With cleaner navigation, clearer categories, and a more intuitive layout, you can now find Power BI guides, accounting workflows, and practical tutorials faster. A small upgrade that makes a noticeable difference to how you learn.

Proud to Support Kiveton Park FC U18 Girls

Kiveton Park Under 18s Yellow sponsored by Select Distinct Limited
Grassroots football thrives on passion, commitment, and community. We’re proud to support the U18 Girls at Kiveton Park FC as they continue to grow, compete, and inspire. This post shares why backing local sport matters — and how small contributions can make a real difference

Using QUOTIENT and MOD in Power BI

Quotient and Mod in Power BI
QUOTIENT and MOD are two simple DAX functions that unlock powerful logic in Power BI. This guide shows you how they work, when to use them, and how they can simplify calculations that look complex at first glance. A great introduction to smarter, more modular DAX.

We hope these insights help you drive better data decisions.

If you have any questions about applying this to your own business, feel free to Contact Us – we’re always happy to help.

Frequently Asked Questions

  • What topics does this blog cover?

    Power BI, SQL, BigQuery, Excel, data integration, automation, management reporting, and analytics strategy.

  • Is this blog suitable for beginners?

    Yes - many guides are written for beginners, with clear examples and step‑by‑step instructions.

  • Do you publish advanced content?

    Absolutely. Topics like window functions, data modelling, and automation are covered in depth.

  • How often is the blog updated?

    New posts are added regularly, covering both technical tutorials and strategic insights.

  • Can I request a topic?

    Yes - you’re welcome to reach out with suggestions or questions.