Services

Technologies

Industries

About Us

Our Work - Case Studies

Business Analytics Blog Power BI

Data Insights & Practical BI Guidance
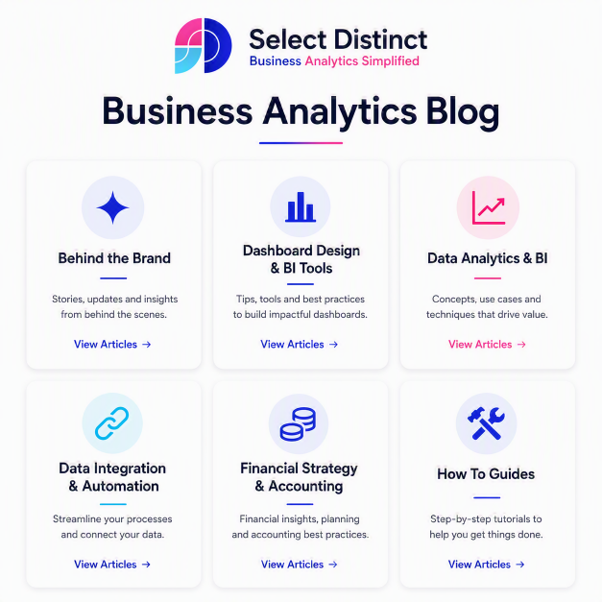
Business Analytics Blog

Strategic Insights

The Select Distinct Business Analytics Blog is your hub for practical, real‑world guidance on Power BI, SQL, data analytics, automation, and management reporting.

Whether you’re building dashboards, improving data processes, or levelling up your analytics skills, this blog provides clear, actionable tutorials designed for busy professionals.

You’ll find hands‑on walkthroughs, time‑saving techniques, and strategic insights that help you solve real business problems — not just learn software features.

With content spanning Power BI, SQL Server, BigQuery, Excel, data warehousing, automation, and leadership, the blog supports analysts, managers, and business teams who want to make better decisions with data.

New posts are added regularly, covering everything from foundational concepts to advanced modelling, reporting, and integration techniques.
If you want to build reliable analytics, streamline reporting, and understand the “why” behind BI best practices, this blog is built for you.

Welcome to the Business Analytics Blog

Business analytics should make your work clearer, not more complicated. This blog is here to help you get there. Whether you’re building dashboards in Power BI, writing SQL to clean and shape data, or trying to make sense of data modelling and reporting best practices, you’ll find practical guidance you can actually use.

Every article is written with real business problems in mind — the kind analysts, managers, and teams face every day. You’ll learn how to design cleaner dashboards, automate repetitive reporting, improve data quality, and turn raw information into insights people can trust.

If you want to strengthen your analytics skills, understand Power BI more deeply, or build a more confident approach to business intelligence, this blog gives you the tools, techniques, and clarity to move forward.

This Blog Is Ideal For:

Data Analysts & BI Developers

Build and scale BI infrastructure.

Finance & Operations Teams

Optimize assets and internal workflows.

Learners Wanting To Understand Data

Grasp core data concepts easily.

SQL & Power BI Learners

Master queries and visual reports.

Reporting Managers

Track KPIs and team performance.

Small Business Owners

Grow and manage your venture.

Category Filter

Tag Filter

Latest Posts
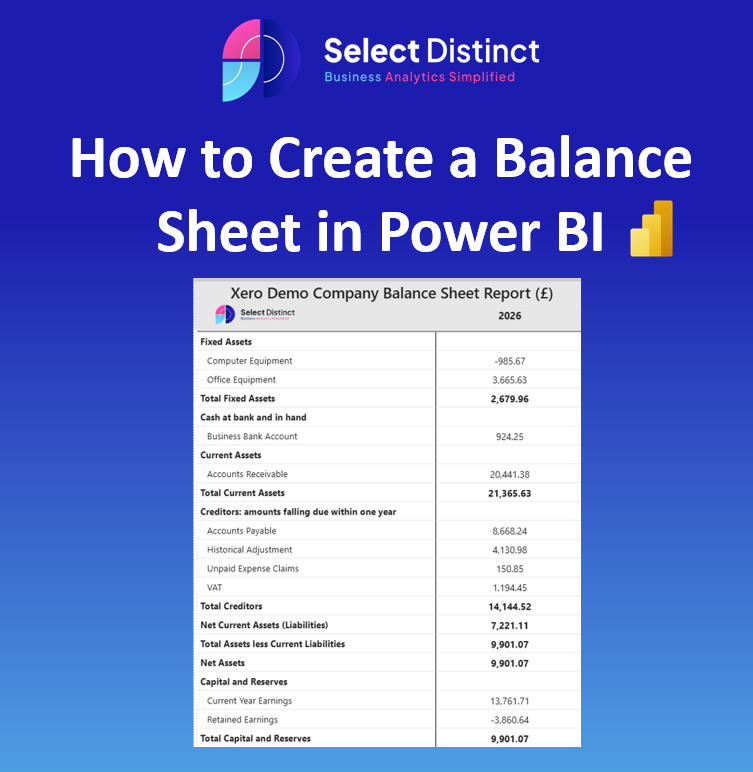
How to Build a Clean Balance Sheet in Power BI

How to build a Balance Sheet in Power BI
Learn how to build a clean, structured balance sheet in Power BI using custom mapping tables and DAX measures. This step-by-step guide walks you through transforming raw financial data into a polished, executive-ready dashboard

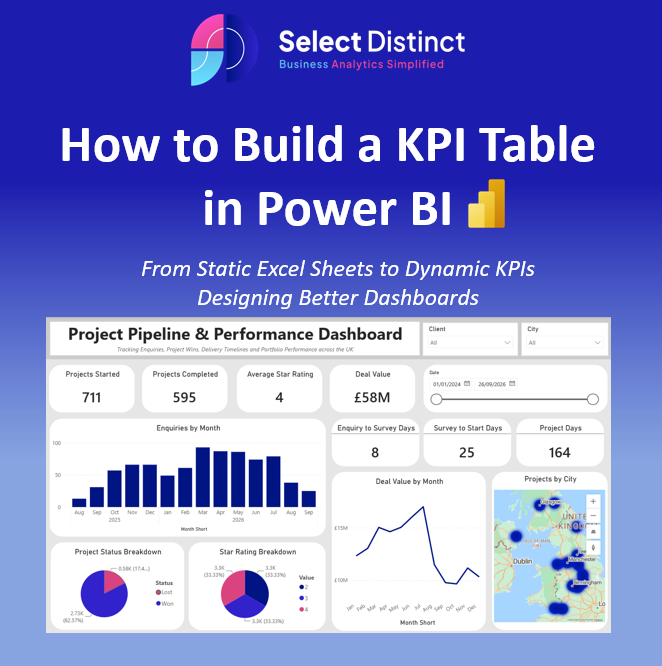
How to Build a KPI Table in Power BI

How to Build a KPI Table
By moving away from wide, flat sheets and towards unpivoted attribute tables and proper dimensional modelling, your Power BI reports transform into dynamic, scalable solutions. Tailoring these KPIs to your specific business operations ensures your dashboards deliver meaningful, actionable insights that drive real performance.

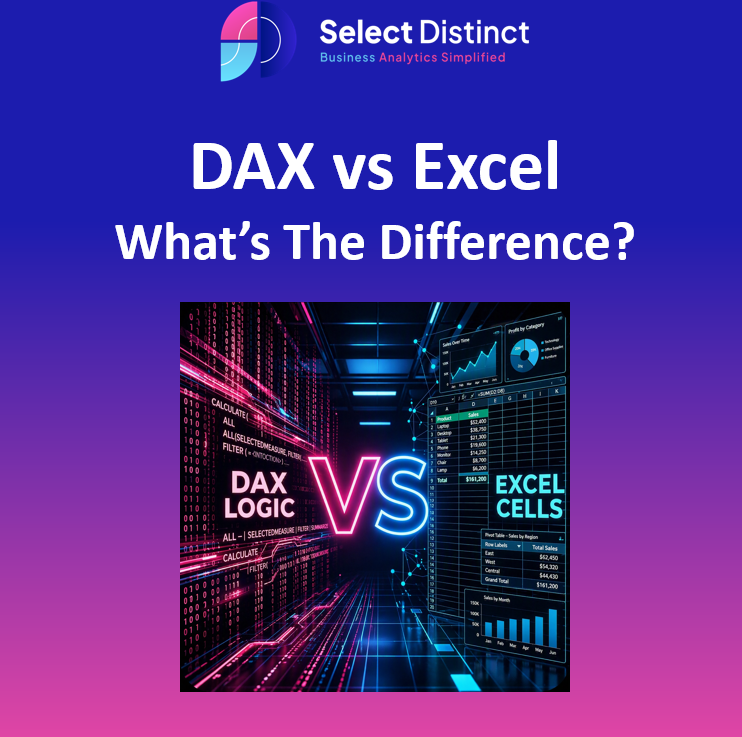
DAX vs Excel Formulas: What’s the Real Difference?

DAX vs Excel
Excel formulas rely on fragile, cell-by-cell connections that often break as your data grows and becomes more complex. DAX moves beyond this, using a model-driven engine to provide dynamic, automated, and scalable insights for your business.

Power BI: Why Your Slicer Isn’t Filtering

Power BI: Why Your Slicer Isnt Filtering
Struggling with a Power BI slicer that refuses to filter your visuals? Check these three common setup mistakes to quickly identify the issue and get your dashboard back on track.

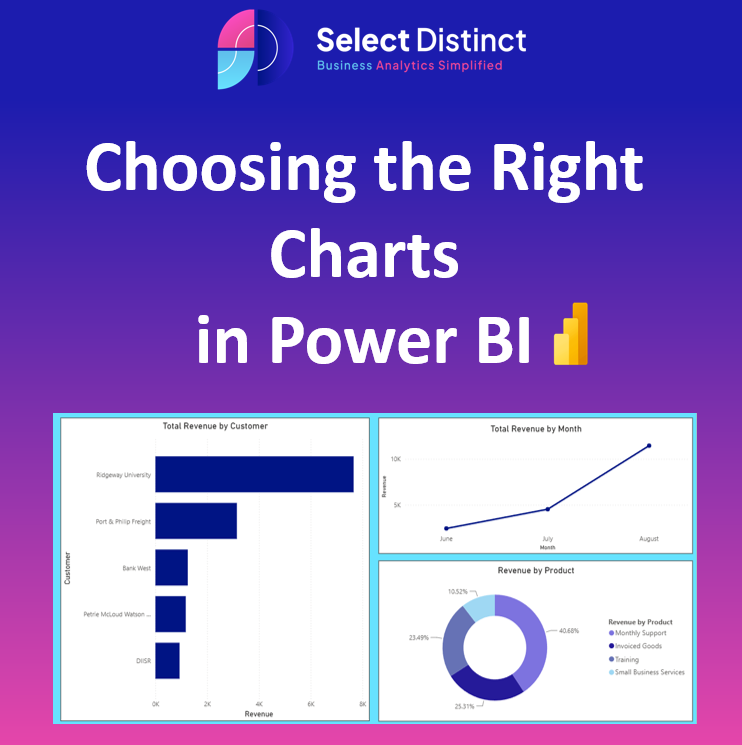
Choosing the Right Charts in Power BI

Choosing the right chart in Power BI
Choosing the right chart is the most important step in turning a mess of numbers into clear, useful facts. By picking the format that best fits your goal, you ensure your audience can find the insights they need at a glance.

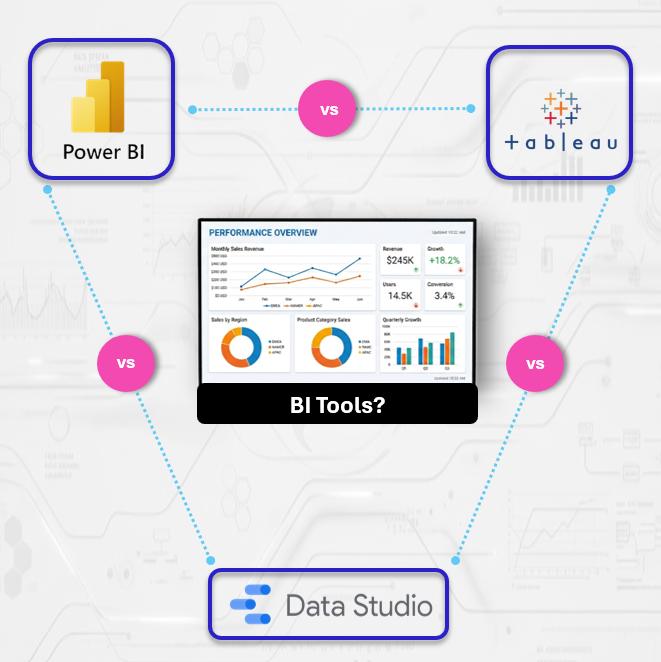
How to Choose the Right BI Tool?

Power Bi vs Tableau vs Data Studio
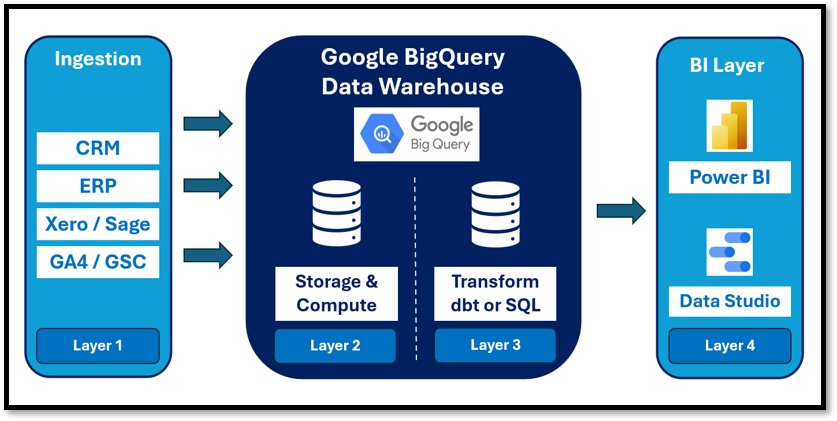
Choosing the right BI tool requires aligning your platform choice with your team's existing technical architecture and long-term data strategy rather than focusing solely on feature lists. By starting with a tool like Data Studio and only upgrading to Power BI or Tableau when you encounter limitations in modelling or governance, you can avoid the common mistake of over-buying enterprise tools you lack the capacity to maintain.

Data Studio – The Re-Rebrand

Google Data Studio, Looker Studio, Data Studio renamed
Google has officially brought back the Data Studio name, finally drawing a clear line between its flexible reporting tool and the governed Looker platform. Discover what this "re-rebrand" means for your 2026 data strategy and how the new AI-driven features are changing the game.

The UK Data Job Market: A Power BI Perspective

UK Data Job Market using Power BI
This analysis uses Power BI to map active UK data vacancies sourced from reed.co.uk, providing clear benchmarks for salaries and hiring trends. It explores the "Remote Premium," regional growth hubs, and high-demand sectors to help professionals turn market data into actionable job leads.

Power BI Map Not Working? How to Fix Location Errors

Power BI Map Not Working? How to Fix Location Errors
Fix Power BI location errors by moving beyond messy raw data to a structured geographic hierarchy. This guide demonstrates how to use AI classification and DAX "anchoring" to achieve 100% map accuracy.

Select Distinct Named a Top 20 Business Analytics Blog for 2026

Hand pointing at a desktop monitor displaying Select Distinct Business Analytics Blog dashboard with charts and data visualisations.
The "Select Distinct" Business Analytics Blog has been recognised as one of the top 20 industry resources for 2026, highlighting its commitment to providing high-quality data insights. This accolade underscores the site's role as an essential hub for professionals seeking to navigate the evolving landscape of business intelligence and data strategy.

Export Outlook Mailbox to Excel via Power Query 

Graphic titled ‘How to Export Outlook Mailbox Data to Excel Using Power Query,’ featuring Outlook and Excel icons on a gradient background.
Tired of manual copy-pasting? This guide demonstrates how to use Power Query to directly connect Excel to your Outlook folders for seamless data extraction. Learn to transform messy email metadata into a clean, structured table that updates with a single click.

We hope these insights help you drive better data decisions.

If you have any questions about applying this to your own business, feel free to Contact Us – we’re always happy to help.

Frequently Asked Questions

  • What topics does this blog cover?

    Power BI, SQL, BigQuery, Excel, data integration, automation, management reporting, and analytics strategy.

  • Is this blog suitable for beginners?

    Yes - many guides are written for beginners, with clear examples and step‑by‑step instructions.

  • Do you publish advanced content?

    Absolutely. Topics like window functions, data modelling, and automation are covered in depth.

  • How often is the blog updated?

    New posts are added regularly, covering both technical tutorials and strategic insights.

  • Can I request a topic?

    Yes - you’re welcome to reach out with suggestions or questions.